Mean Absolute Deviation (MAD) in Demand Forecasting
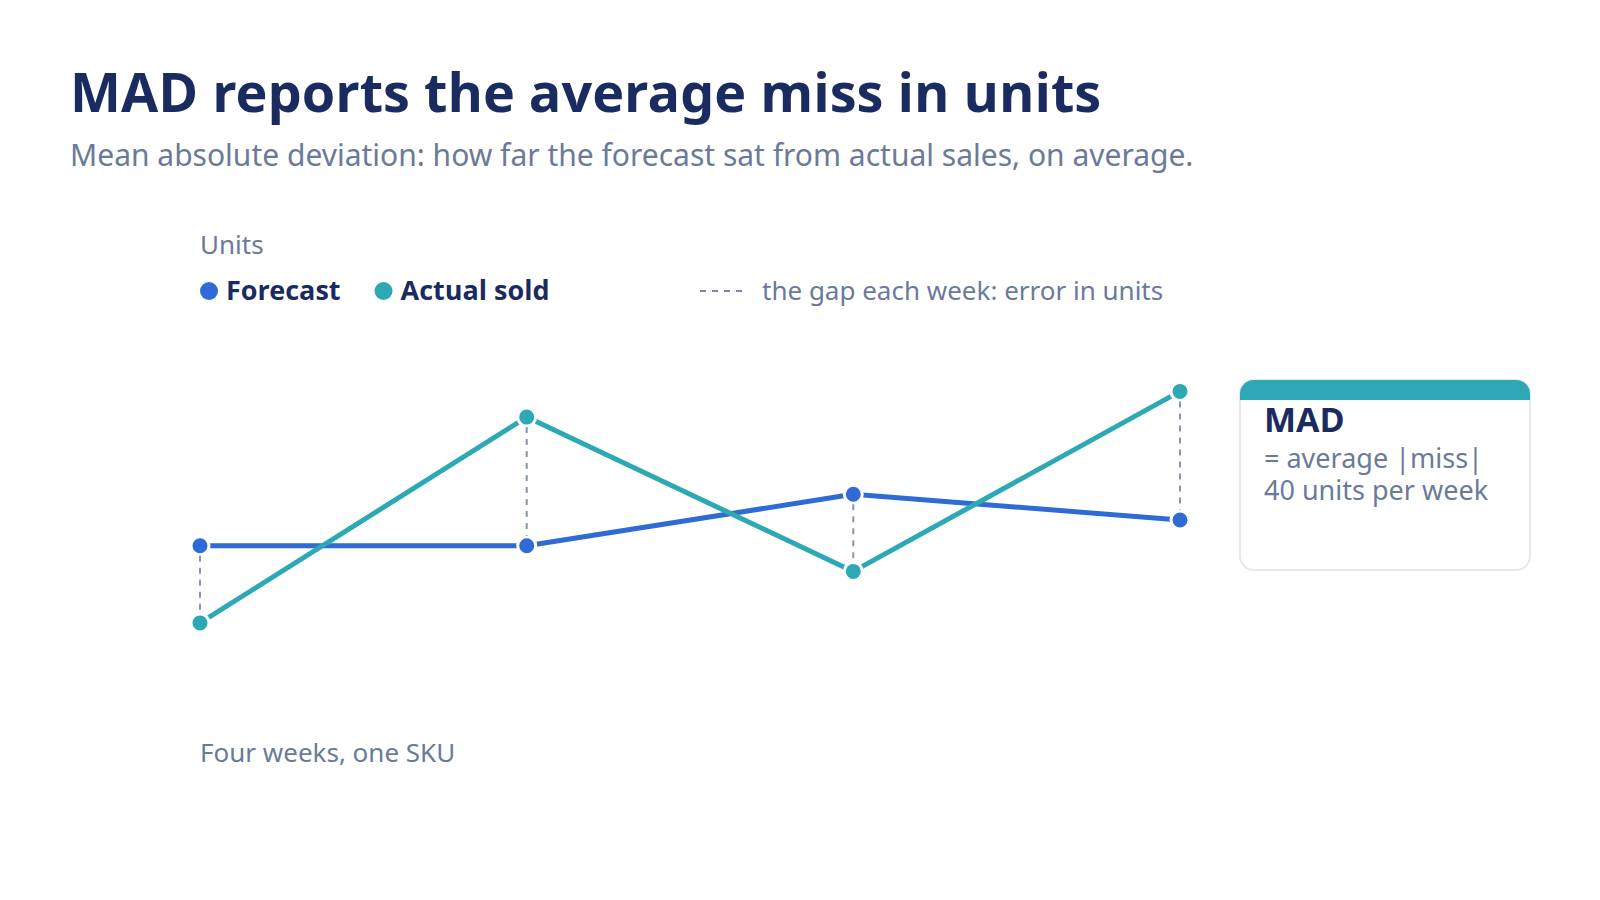
MAD measures forecast error in units, not percent. Learn the mean absolute deviation formula, a worked example, the MAD/mean ratio, and when MAD beats MAPE.
Quick clarification first: this is MAD as in *forecasting*, mean absolute deviation, the average size of your forecast misses in units. It's not the "MAD" from statistics or equities (median absolute deviation, or mean absolute difference). Same three letters, different job. This whole post is about the forecasting one.
Your purchase orders are written in units. You order 500, receive 500, count 500 on the shelf. So why grade the forecast that drives those orders in percentages? That mismatch is why a lot of planners reach for MAD. It answers "how far off were we" in the same currency you actually buy in.
MAD (Mean Absolute Deviation) is the average size of your forecast errors, measured in units rather than percentages. You take the absolute gap between forecast and actual demand for each period, then average those gaps. A MAD of 40 means the forecast missed by about 40 units per period. Staying in units, it speaks the language of your reorder quantities.
What is MAD and how do you calculate it?
MAD is the average of your absolute forecast errors across a set of periods. You strip the sign off each miss, so an over-forecast and an under-forecast of the same size count equally, then take the mean. The result is one number, in units, telling you the typical distance between what you predicted and what actually sold.
Planners like it for the honesty of scale. A MAD of 40 on a SKU that sells 500 a week is a different story from a MAD of 40 on one that sells 45. You read both at a glance, because the number never leaves the unit space your buying lives in.
The MAD formula in plain English
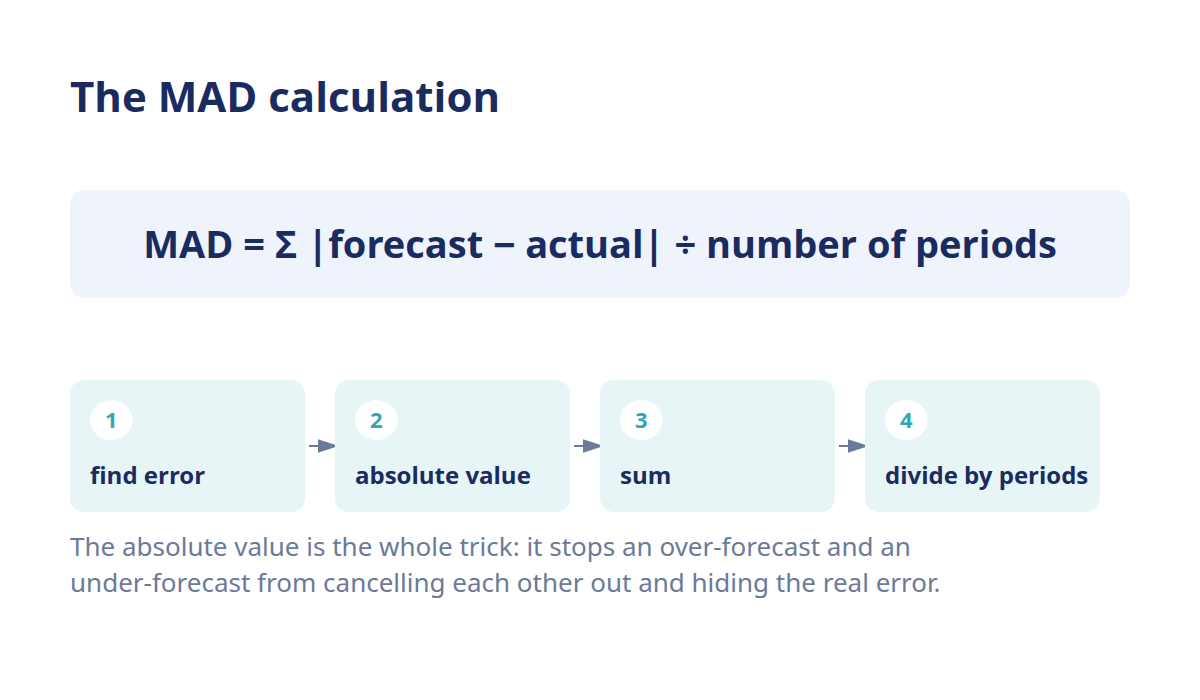
The formula reads: MAD = the sum of |forecast − actual| across all periods, divided by the number of periods.
Walk it left to right and it's just four moves:
- Find each period's error, subtract actual from forecast (or forecast from actual; MAD ignores direction).
- Take the absolute value, drop the minus sign so misses don't cancel each other out.
- Add up those absolute errors across every period you're measuring.
- Divide by the number of periods to get the average.
That's it. No division by actual, no squaring, no roots. The raw per-period gap before averaging is forecast error, and MAD is just the tidy average of it. The *direction* of the miss, always high or always low, is a separate read called forecast bias, which MAD throws away by taking absolutes.
A worked MAD example
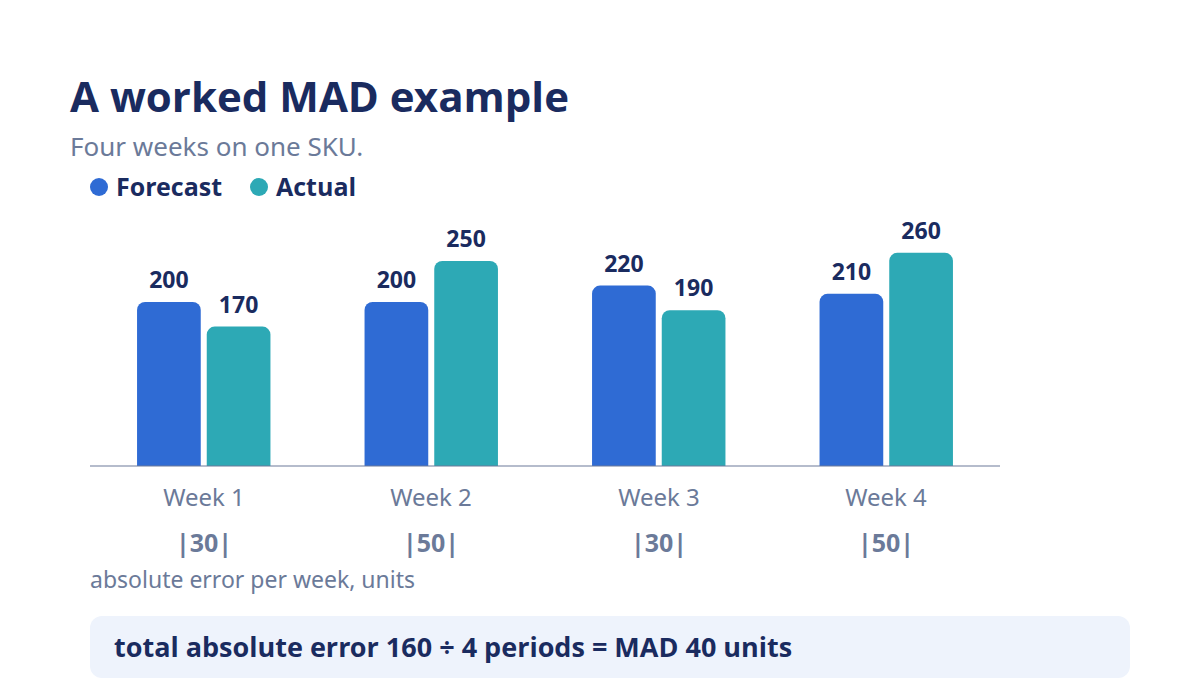
Here's a small SKU tracked over four weeks. These are illustrative numbers, so plug your own history in when you run it.
- 1: forecast: 200; actual: 170; error (f − a): +30; absolute error: 30
- 2: forecast: 200; actual: 250; error (f − a): −50; absolute error: 50
- 3: forecast: 220; actual: 190; error (f − a): +30; absolute error: 30
- 4: forecast: 210; actual: 260; error (f − a): −50; absolute error: 50
- Total: error (f − a): −40; absolute error: 160
Add the absolute errors: 30 + 50 + 30 + 50 = 160. Divide by 4 periods: MAD = 40 units.
Notice the signed errors sum to −40, not zero, the forecast leans a touch low here. MAD doesn't care about that lean; it only reports magnitude. On average, this forecast is off by 40 units a week, either direction. That's your buying-relevant miss.
MAD in units vs MAPE in percent, why the unit matters
MAD keeps the answer in units you can act on; MAPE normalizes the same errors into a percentage. They answer different questions. MAD tells you *how many units* the forecast typically misses by; MAPE tells you *what share* of demand that miss represents. You buy in units but report in percentages, so most planners end up wanting both.
The catch: a percentage compares cleanly across SKUs, but raw units don't, 40 units means one thing on a hero SKU and another on a slow mover. That's the gap the MAD/mean ratio closes.
The MAD/mean ratio makes MAD comparable across SKUs
Raw MAD can't be stacked across products, because a big SKU naturally carries bigger unit errors. The fix is to divide MAD by that SKU's average demand, the MAD/mean ratio (sometimes called relative MAD).
Take our example: MAD was 40 units, and average weekly demand was (170 + 250 + 190 + 260) ÷ 4 = 217.5 units. So MAD/mean = 40 ÷ 217.5 ≈ 0.18, or about 18%. Now you've got a normalized figure to line up against any other SKU's ratio, while still keeping the raw MAD for the buying conversation.
Reading MAD against your reorder quantity
A unit-based error is one you can hold next to a unit-based decision. Say a SKU's MAD is 40 units and you reorder in cases of 24. Your typical miss is nearly two cases, enough to sway whether you round an order up or down. That's a call you can actually make, because both numbers are in the same units. Try it with a percentage and you're back to mental math under pressure.
When does MAD beat MAPE?
MAD earns its place on low-volume and intermittent SKUs, where MAPE gets unstable. MAPE divides by actual demand. So when a slow mover sells 2 units against a forecast of 5, that period reads as 150% error, a number that panics dashboards. MAD on the same period just says "off by 3 units": calm, true, and actionable.
Best-sellers with steady volume are comfortable ground for either metric. But your long tail, the slow movers, the seasonal one-offs, the SKUs that sell in bursts, is where percentage error blows up. Unit error keeps its head.
Slow movers and lumpy demand
Intermittent demand is the classic MAD case. When a SKU sells nothing for three weeks then moves 12 units in one, MAPE swings between undefined (dividing by zero) and enormous. MAD absorbs the same pattern into a stable average of unit misses. If you run a catalog with a heavy long tail, most eCommerce brands do, MAD is often the steadier read on the products that quietly tie up cash.
MAD as the input to a tracking signal
MAD isn't only a report card, it's a working part inside a bigger tool. A tracking signal divides the running total of your signed errors by MAD to flag when a forecast has drifted too far to trust. MAD sets the "normal error" baseline; when cumulative bias grows to several times that baseline, the signal trips for review. We won't build that tool here, the tracking-signal post owns the control limits, but your MAD number does double duty.
That's also where doing it by hand stops scaling. Recomputing MAD every period across a few thousand SKUs, then watching each for drift, isn't a spreadsheet job for long. Conative's AI-powered forecast accuracy tracking calculates metrics like MAD per SKU automatically and surfaces the ones slipping out of tolerance. You spend less time recalculating and more time deciding what to reorder. For where MAD sits among the other accuracy metrics, start with our hub on how to measure forecast accuracy.
Frequently asked questions
Is MAD the same as MAE?
Yes, in forecasting they're the same calculation. MAD (Mean Absolute Deviation) and MAE (Mean Absolute Error) both average the absolute gaps between forecast and actual. Inventory and operations teams tend to say MAD, while data-science teams often say MAE. If someone hands you one, treat it as the other, the math is identical.
How do you make MAD comparable across products?
Divide MAD by that SKU's average demand to get the MAD/mean ratio, sometimes called relative MAD. A MAD of 40 on a SKU averaging 220 units is about 18%, which you can line up against any other SKU's ratio. Keep the raw MAD for buying decisions and use the ratio when you need to compare across a catalog.
What's a good MAD value?
There's no universal target, because MAD is in units and scales with each SKU's volume. A MAD of 40 is small on a best-seller and large on a slow mover. Judge it as a MAD/mean ratio and against your own trend over time. Whether MAD is "good" depends on the reorder quantity and service level it feeds.
Does MAD penalize big misses less than RMSE?
Yes. MAD treats every unit of error equally, so one large miss counts the same as several small ones. RMSE squares the errors first, which makes big misses hurt far more. Use MAD when steady average performance matters; use RMSE when a single large stockout is the thing you most want to catch.
Is MAD better than MAPE for slow movers?
Usually, yes. MAPE divides by actual demand, so low-volume and intermittent SKUs produce huge or undefined percentages that mislead. MAD stays stable because it reports the miss in units. On steady best-sellers either metric works, but for a long tail of slow or lumpy items, MAD is the calmer, more actionable read.
How does MAD feed a tracking signal?
A tracking signal divides the cumulative signed forecast error by MAD, giving a ratio that flags when a forecast has drifted in one direction. MAD sets the baseline for "normal" error size; when the running bias grows to several multiples of it, the signal trips for review. MAD is the denominator that makes the signal comparable across SKUs.