RMSE in Demand Forecasting, Explained
RMSE squares your forecast errors so big misses hurt more. Learn the RMSE formula with a worked example, how it compares to MAE and MAD, and when to prefer it.
One ugly forecast miss on a top SKU can blow up your whole season. You nailed the forecast for five weeks straight, then week six a promo ran hotter than anyone planned, and you sold out by Wednesday. Average-based metrics smooth that week away and tell you the forecast was "fine." RMSE refuses to let that miss hide.
RMSE (Root Mean Square Error) is the square root of the average squared forecast error. Squaring makes large misses count far more than small ones, so RMSE flags the outlier weeks that average-based metrics smooth over. It's the metric to reach for when a single big stockout is the thing you most want to avoid.
What is RMSE and how do you calculate it?
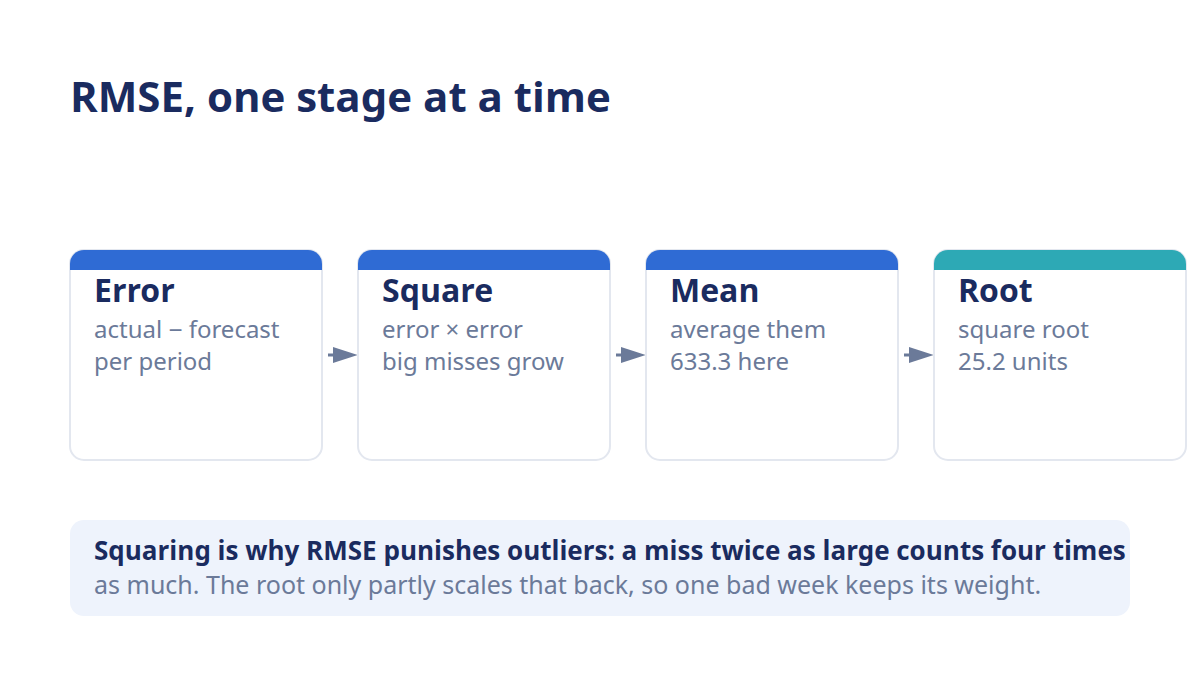
RMSE stands for Root Mean Square Error, and it measures the typical size of your forecast miss while giving extra weight to the big ones. In plain terms: take each period's forecast error, square it, average those squares, then take the square root to get back to real units. The formula is RMSE = √(mean of (actual − forecast)²).
Read it back to front and it's less intimidating than it looks. Every accuracy metric starts from the same raw ingredient, the per-period forecast error. RMSE just processes that error through four steps: error, square, mean, root. The squaring is where RMSE earns its personality, and the root is what pulls the answer back into the units you actually buy in.
The formula, step by step
Here's what each step is doing, in order:
- Error: subtract forecast from actual for each period. A week you sold 170 against a forecast of 110 has an error of 60.
- Square: multiply each error by itself. That 60-unit miss becomes 3,600, while a 5-unit miss becomes just 25.
- Mean: average all the squared errors across your periods.
- Root: take the square root of that average to land back in units.
Squaring is the whole trick. It punishes a 60-unit miss far more than twelve separate 5-unit misses, even though the raw units are similar. The root then rescales everything so RMSE reads in the same units as your sales, not in squared units nobody can picture.
A worked example
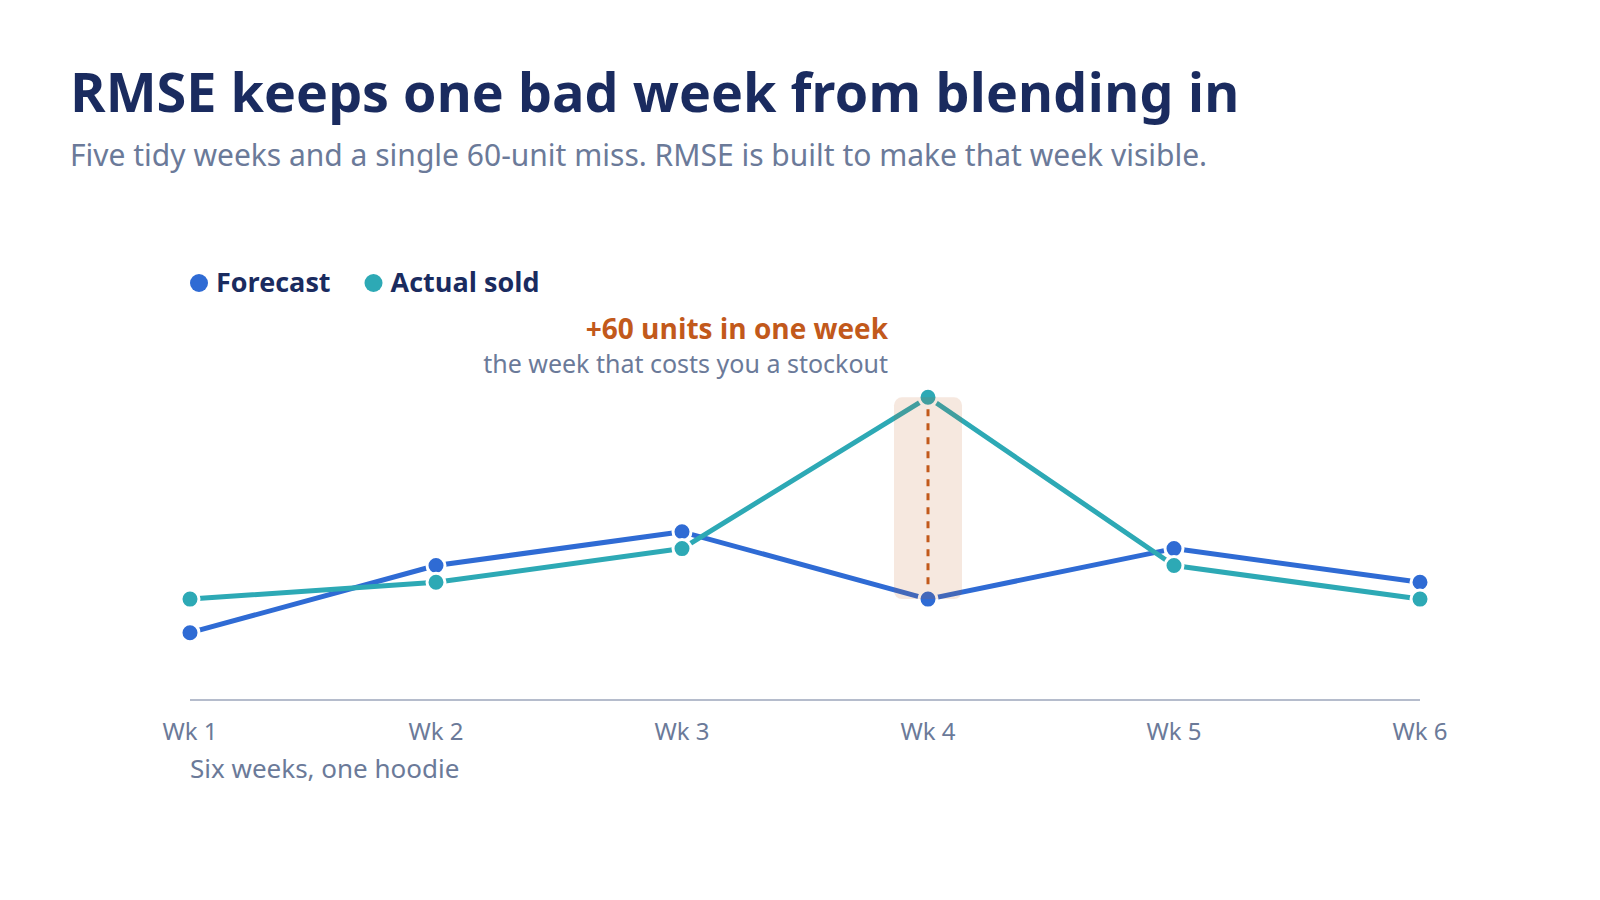
Say you forecast a hoodie over six weeks. Five weeks are tidy. Week 4 goes sideways.
- 1: forecast: 100; actual: 110; error (actual − forecast): +10; squared error: 100
- 2: forecast: 120; actual: 115; error (actual − forecast): −5; squared error: 25
- 3: forecast: 130; actual: 125; error (actual − forecast): −5; squared error: 25
- 4: forecast: 110; actual: 170; error (actual − forecast): +60; squared error: 3,600
- 5: forecast: 125; actual: 120; error (actual − forecast): −5; squared error: 25
- 6: forecast: 115; actual: 110; error (actual − forecast): −5; squared error: 25
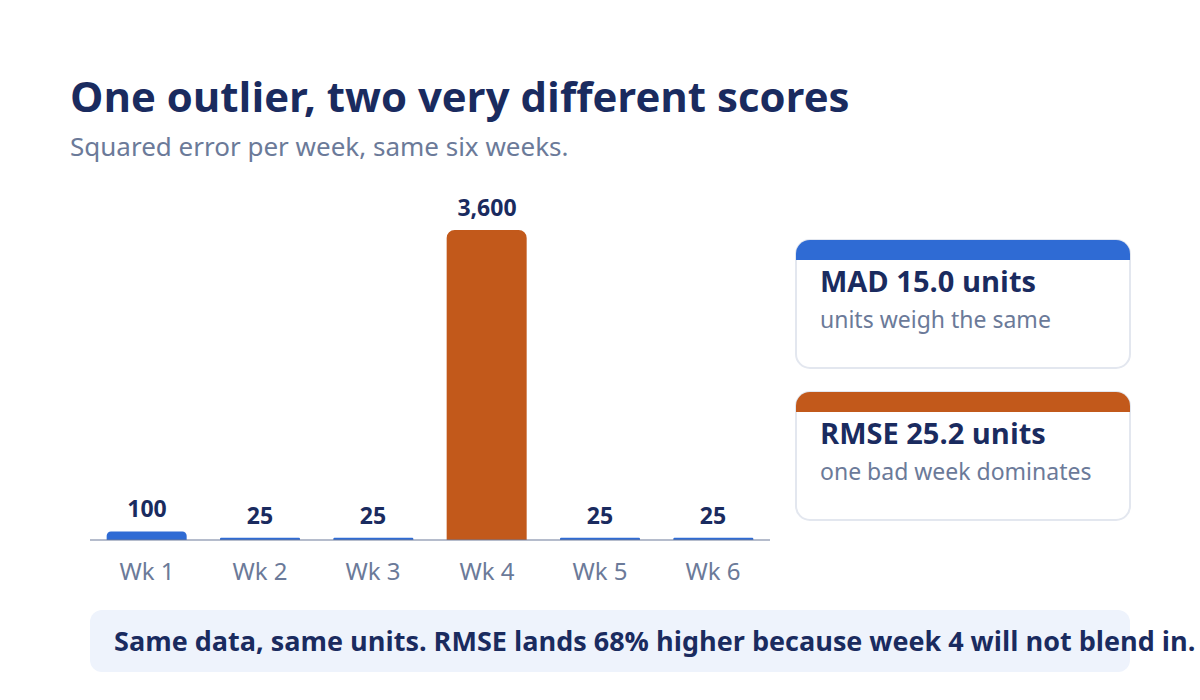
Add the squared errors: 100 + 25 + 25 + 3,600 + 25 + 25 = 3,800. Divide by 6 periods to get the mean squared error, 633.3. Take the square root and your RMSE is about 25.2 units. That single 60-unit week drags the whole score up, which is exactly the behavior you want when that week is the one that cost you a stockout.
Why does RMSE punish big misses?
RMSE punishes big misses because squaring the error before averaging gives outliers outsized weight, and the square root only partly scales it back. A miss twice as large doesn't count twice as much, it counts four times as much in the squared step. That's why RMSE stays high whenever a forecast has even one bad week hiding among good ones.
Think about what that does to the six-week hoodie above. The MAD on that data (mean absolute deviation, identical to MAE for a single series) is only 15 units, because five calm weeks dilute the one disaster. RMSE lands at 25.2 units, more than half again as high, because the squaring won't let week 4 blend in. The gap between the two numbers is itself a signal: a wide spread means your errors are lumpy, not steady.
Your past sales data is gold, but a metric that averages away your worst weeks is fool's gold.
What that means for risk-sensitive SKUs
Some misses cost more than others. A stockout on your hero product loses the sale, the ad spend that drove the click, and sometimes the customer for good. On SKUs like that, you don't want a metric that shrugs off the occasional catastrophic week. You want one that flags it loudly so it lands on your review list.
That's the case for grading risk-sensitive SKUs with RMSE. It's less forgiving by design. When the downside of a single big miss is severe, a metric that refuses to smooth over big misses is doing you a favor, not being pedantic. Match the metric to the pain, not to habit.
RMSE vs MAE and MAD: when to prefer RMSE
RMSE and MAE/MAD answer different questions. MAE and MAD treat every unit of error equally and hand you the average miss in plain units. RMSE leans toward catching the rare large error by weighting it heavily. On the same data, RMSE is always greater than or equal to MAE.
Both families measure error in units, so they're easy to read side by side, but they're built for different jobs. MAD, mean absolute deviation, keeps a steady, outlier-tolerant read on your average miss, which suits reporting and slow movers. RMSE deliberately over-reacts to the worst weeks. Neither is "more correct." They emphasize different failure modes, and mature planners often watch both.
Here's a simple way to choose:
- Prefer RMSE when one big miss is costly, when you're grading hero SKUs, or when you specifically want outlier weeks pushed to the top of your review queue.
- Prefer MAE or MAD when steady average performance matters more, when you're reporting a stable number to leadership, or when working with intermittent SKUs where a single spike would distort RMSE too hard.
That's the short version of the trade-off. For a full side-by-side of MAPE, MAD, and RMSE, including which metric fits which SKU profile, see the forecast accuracy metrics comparison. This post owns RMSE; the routing between all three lives there.
Where RMSE fits in an AI-powered forecast
Tracking RMSE by hand is fine for a handful of SKUs. Across a catalog of thousands, recalculating it every cycle and spotting which products are drifting is where the spreadsheet quietly breaks. This is where AI-powered demand forecasting changes the work.
Conative's forecast accuracy tracking scores each SKU's forecast against real sales and surfaces the ones where error is climbing. So the outlier weeks RMSE is built to catch don't sit unnoticed until the stockout hits. Less time recalculating, more time deciding what to buy.
Frequently asked questions
Is RMSE the same as the standard deviation of the errors?
They're close cousins but not identical. RMSE measures the spread of your errors around zero, while standard deviation measures spread around the mean error. When your forecast is unbiased and the average error is near zero, the two land very close together. Once your forecast leans consistently high or low, they diverge.
Why is RMSE always greater than or equal to MAE?
Because squaring inflates large errors before averaging, and the square root doesn't fully undo that inflation. RMSE equals MAE only in the rare case where every period's error is exactly the same size. Any variation in your errors pushes RMSE above MAE, so the gap between them is a quick read on how uneven, or outlier-prone, your misses are.
What is a good RMSE score?
There's no universal number, because RMSE is in units and scales with your sales volume. An RMSE of 25 is tight for a SKU selling 1,000 a week and alarming for one selling 30. Judge RMSE against that SKU's own demand level and its trend over time, not against a fixed benchmark or against a different product's score.
Is RMSE measured in the same units as sales?
Yes, and that's the point of the square root step. Squaring the errors puts them in squared units, which nobody can picture, so taking the root pulls the result back into real units like pieces or cases. An RMSE of 25 units means your typical weighted miss is about 25 units, in the same language as your purchase orders.
Should I use RMSE or MAPE for retail?
It depends on what you're protecting. RMSE stays in units and punishes big misses, which suits hero SKUs where one stockout is expensive. MAPE gives a shareable percentage but distorts on low-volume items. Many retail planners pair a magnitude metric like RMSE with a percentage view, then read them together rather than picking one winner.
Does RMSE work for intermittent demand?
Not well on its own. Intermittent, lumpy SKUs sell nothing for stretches, then spike, and RMSE treats each spike as a large squared error that dominates the score. That can make an acceptable forecast look terrible. For slow or irregular movers, a steadier metric like MAD usually gives a fairer read, so reserve RMSE for products with regular, meaningful volume.