Inventory Carrying Cost: The Margin You Cannot See
Inventory carrying cost is what it really costs to hold stock, capital, storage, service, and risk. Learn the four components, the 15-30% rule, and how it eats margin.
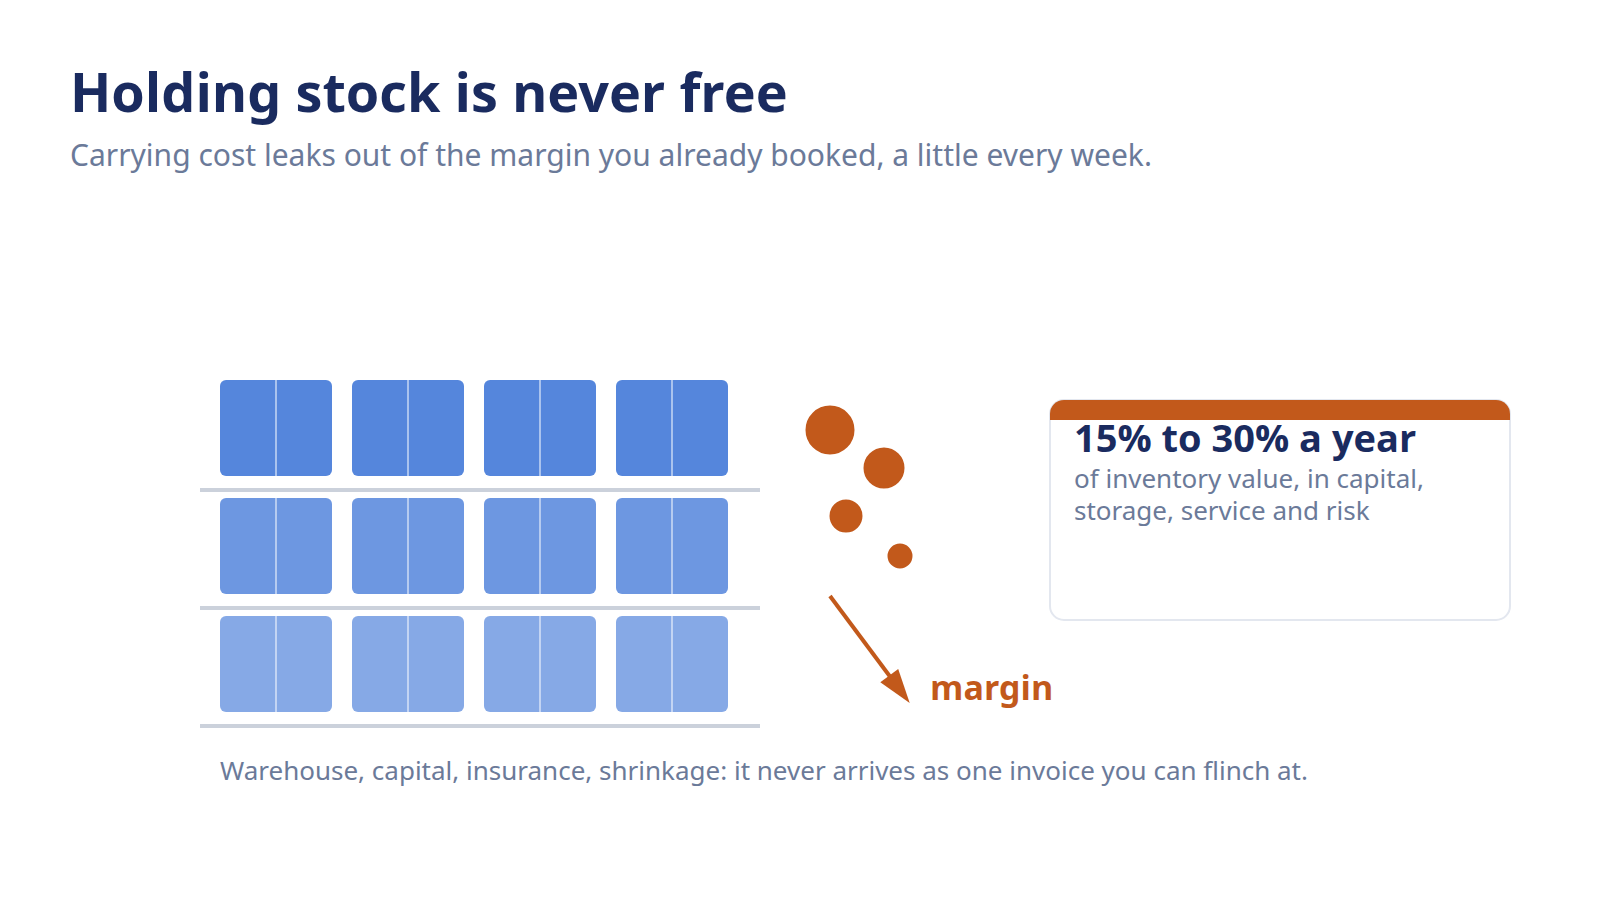
That stock sitting in the back isn't free just because you already paid for it. Every week it sits there, it's quietly billing you, space, cash, insurance, the slow slide toward a markdown. Most brands never see the invoice, so they treat unsold inventory as a paid-for asset instead of an ongoing expense. It's more like a hotel guest who checked in and never left. That's inventory carrying cost, and it's eating margin you probably aren't counting.
Inventory carrying cost is the total cost of holding unsold stock over a year, beyond what you paid for the goods. It bundles four things: capital tied up, storage and handling, inventory service (insurance, taxes, tracking systems), and risk (shrinkage, obsolescence, markdown). For most brands it runs 15% to 30% of inventory value per year, so slow stock erodes margin.
What is inventory carrying cost?
Inventory carrying cost is the annual cost of keeping stock on hand, expressed as a percentage of that inventory's value. It's everything you spend to *hold* a product between the day it lands in your warehouse and the day it ships to a customer.
Crucially, it does not include what you paid the supplier for the goods themselves, that's the cost of the inventory, not the cost of carrying it.
Here's the mental shift that trips people up. On the balance sheet, inventory is an asset. But an asset that just sits there is also a running expense. Cash is locked inside it, warehouse space is booked by it, and every day it ages it gets riskier to sell at full price. Carrying cost is how you put a number on that.
Carrying cost vs ordering cost
These two get blurred, so it's worth being plain. Carrying cost is what you pay to *hold* stock, it climbs the more inventory you keep and the longer you keep it. Ordering cost is what you pay to *replenish* stock, admin, freight setup, receiving labor, and it's charged per order, no matter the size. They pull in opposite directions: order in big batches and ordering cost drops but carrying cost climbs. Balancing the two is exactly the trade-off the economic order quantity formula solves, where carrying cost shows up as the holding cost per unit.
Why carrying cost stays invisible
There's no monthly line item labeled "carrying cost" in your accounting. The pieces are scattered, rent sits in one bucket, insurance in another, a markdown gets written off somewhere else entirely. Because nobody sends you one bill, it's easy to under-count or ignore. That's the trap. The cost is real and recurring; it just never arrives as a single invoice you can flinch at.
What are the four components of carrying cost?
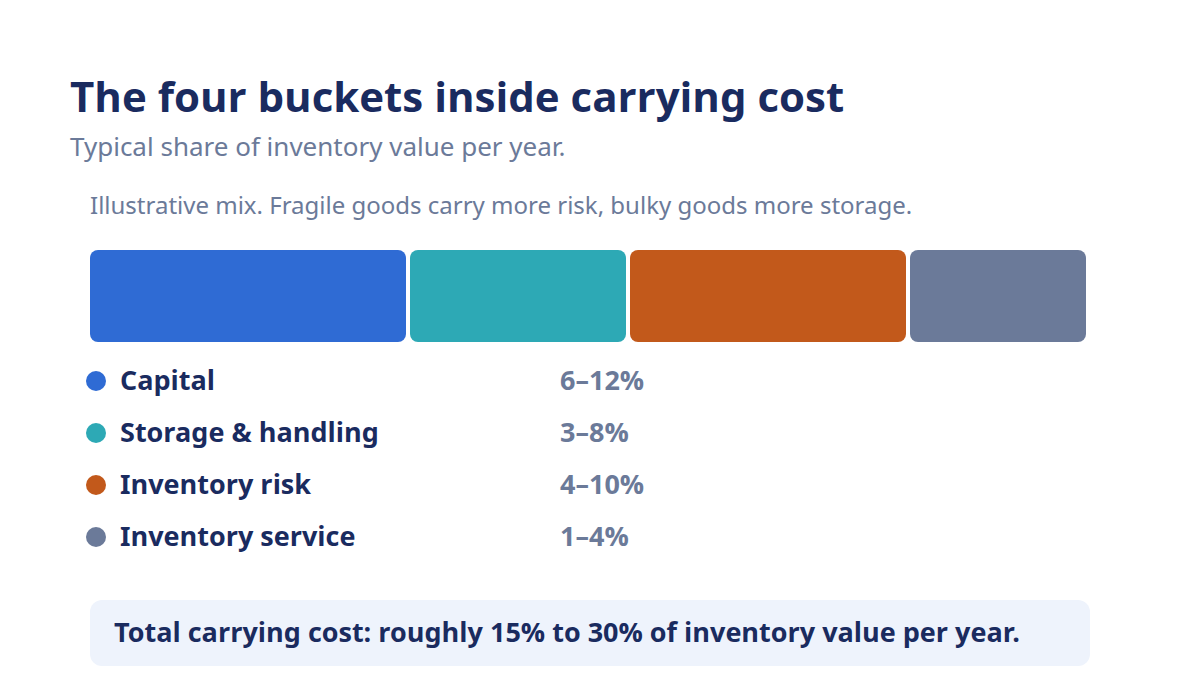
Inventory carrying cost breaks into four buckets: capital cost, storage and handling, inventory service cost, and inventory risk cost. Add them up and most brands land somewhere between 15% and 30% of inventory value per year. Together they cover everything you spend to hold stock.
The mix shifts by category. Fragile or perishable goods carry more risk, bulky goods carry more storage, but the four buckets are always the place to look.
Here's what sits inside each one.
- Capital cost: what it includes: Opportunity cost of cash frozen in stock; interest on financing used to buy it.; typical share of inventory value/yr: 6%-12%
- Storage & handling: what it includes: Warehouse rent or 3PL fees, shelving, utilities, receiving and pick/pack labor.; typical share of inventory value/yr: 3%-8%
- Inventory service: what it includes: Insurance on the goods, property/inventory taxes, and the systems you run to track it.; typical share of inventory value/yr: 1%-4%
- Inventory risk: what it includes: Shrinkage (theft, damage, loss), obsolescence, and markdowns on stock that won't sell at full price.; typical share of inventory value/yr: 4%-10%
- Total carrying cost: what it includes: Sum of all four buckets.; typical share of inventory value/yr: ≈ 15%-30%
*Illustrative ranges, your actual mix depends on category, storage model, and cost of capital.*
Capital cost is the cash frozen in stock
Capital cost is usually the biggest bucket, and it's the one operators most often forget. Every dollar sitting in inventory is a dollar you can't spend on ads, new products, or hiring. If you financed the buy, it's literal interest; if you paid cash, it's opportunity cost, what that money would have earned elsewhere. For a growing eCommerce brand where cash is tight, this bucket bites hardest.
Storage and handling is the space it occupies
This is the cost most people picture first: warehouse rent or 3PL storage fees, shelving, climate control, and the labor to receive, move, and pick the goods. It scales with volume and footprint, so bulky or slow-moving SKUs quietly rack up more than their sales justify. A pallet that turns twice a year is renting the same space as one that turns twelve times.
Inventory service is insurance, tax, and systems
Inventory service cost covers the overhead of simply having the stock on the books. That means insurance premiums on the goods, property or inventory taxes where they apply, and the inventory planning systems you run to manage it. Individually these are small, but they're recurring, and they scale with how much stock you carry.
Inventory risk is the markdown waiting to happen
Inventory risk is the cost of stock that loses value while it sits. Think shrinkage from theft or damage, obsolescence when a product goes out of style or expires, and the markdowns you eventually take to clear it. This bucket is the one that turns "we have plenty" into a margin problem. The longer stock ages, the higher this cost climbs, which is the whole reason slow inventory is expensive inventory.
Why does inventory carrying cost eat margin?
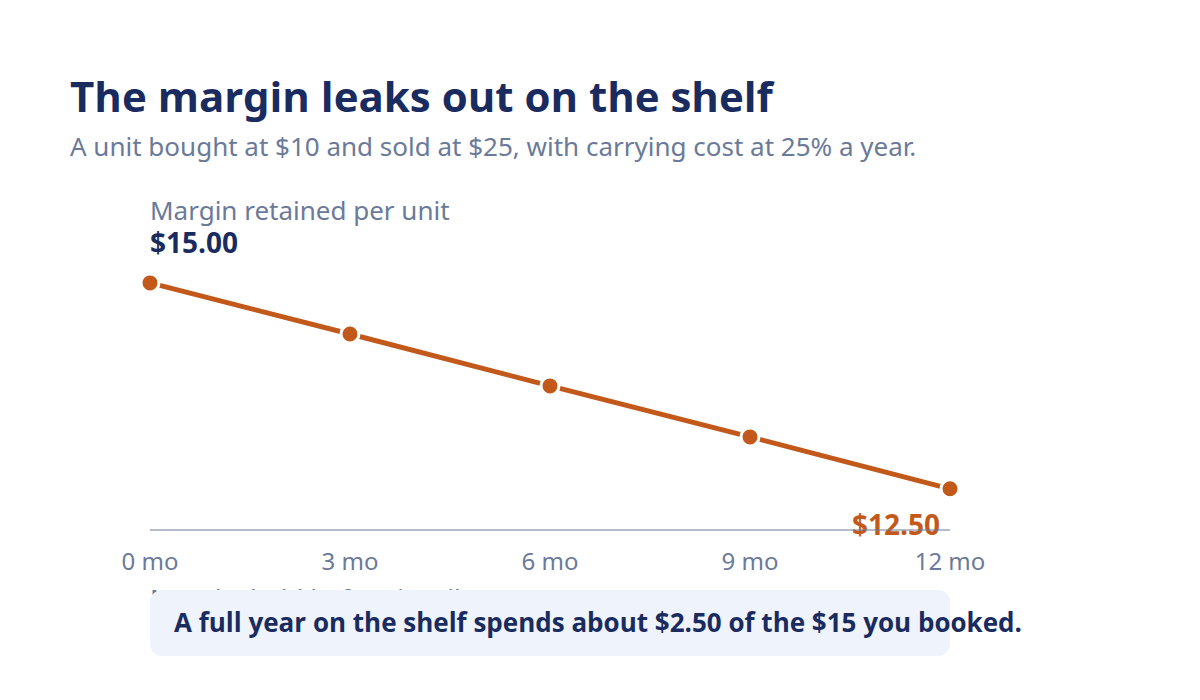
Carrying cost eats margin because it's a percentage charged against inventory value every year, whether that stock sells or not. Hold a product for six months instead of two and you've paid three times the carrying cost on it, straight out of the margin you booked at sale.
Slow-moving and overstocked SKUs are the worst offenders, because they sit longest and accumulate the most cost before they ever convert.
Picture a product you buy for $10 and sell for $25. On paper that's a healthy $15 gross margin. But say carrying cost runs 25% a year and that unit sits for a full year before selling. You've quietly spent about $2.50 holding it, and your real margin is closer to $12.50. Let it sit two years, or mark it down to move it, and the math gets uglier fast. The margin didn't vanish at the register; it leaked out on the shelf.
The 15% to 30% rule of thumb
Most brands land between 15% and 30% of inventory value per year in total carrying cost, with 20% to 25% a common working estimate. Use a rough-but-honest number rather than a precise-but-invented one, the point isn't a perfect figure, it's building the instinct that stock has a running price tag. Once you can name that percentage, "just buy extra to be safe" stops sounding free.
How carrying cost drives leaner buying
When you can see carrying cost, your buying discipline changes. You buy tighter, favor faster-turning SKUs, and get serious about clearing dead stock before it drags the number up. It's also the cost hiding inside your profitability ratios. A high carrying cost quietly drags down GMROI, the metric that shows how many margin dollars each dollar of inventory actually earns. Reducing what you carry, and how long you carry it, lifts both.
This is where AI-powered demand forecasting earns its keep. When you can see which SKUs are about to overstay, you buy to real forecasted demand instead of gut feel. You stop funding stock that just sits and bills you. Conative's inventory planning platform flags slow movers and sizes buys against forecasted demand, so less cash gets frozen in stock that ages toward a markdown. The saving is not in any single line of the formula. It is in holding the same service level on less stock.
Frequently asked questions
What percentage is inventory carrying cost?
Inventory carrying cost typically runs 15% to 30% of inventory value per year, with 20% to 25% a common working estimate. The exact figure depends on your cost of capital, storage model, and how much risk your products carry. Fragile, perishable, or fast-obsoleting goods sit at the higher end. Use an honest rough number rather than an invented precise one.
Is carrying cost the same as holding cost?
Yes, carrying cost and holding cost are the same thing, two names for the total annual cost of keeping stock on hand. You'll see "holding cost" used most often inside the economic order quantity formula, where it's expressed as a cost per unit per year. "Carrying cost" is the broader term for the same four-component expense, usually stated as a percentage of inventory value.
What are the four components of carrying cost?
The four components are capital cost, storage and handling, inventory service cost, and inventory risk cost. Capital cost is cash frozen in stock plus any financing interest. Storage and handling is warehouse space, utilities, and labor. Inventory service cost is insurance, taxes, and tracking systems. Inventory risk cost is shrinkage, obsolescence, and markdowns. Added together across a year, they usually total 15% to 30% of the inventory's value.
Does carrying cost include the cost of the goods?
No. Carrying cost is only what it costs to hold the stock, capital, storage, service, and risk. The price you paid your supplier for the goods is the cost of the inventory itself, tracked separately as cost of goods sold. Keep the two apart. Carrying cost is the recurring annual expense you can reduce by holding less stock for less time.
How does carrying cost relate to EOQ?
Carrying cost is one of the two forces the economic order quantity formula balances. Inside EOQ it appears as holding cost per unit per year, and it pushes toward smaller, more frequent orders. The more expensive stock is to hold, the less you want sitting around. Ordering cost pulls the other way. EOQ finds the order size where the two costs hit their lowest combined total.
How do I lower my inventory carrying cost?
You lower carrying cost by holding less stock for less time. That means buying tighter to real demand, prioritizing faster-turning SKUs, clearing dead stock before it ages into deeper markdowns, and negotiating better storage terms. Because the biggest bucket is usually capital tied up, freeing cash from slow inventory has the largest effect. Accurate demand forecasting helps you avoid over-ordering in the first place.