GMROI: Turning Inventory Into Gross Margin
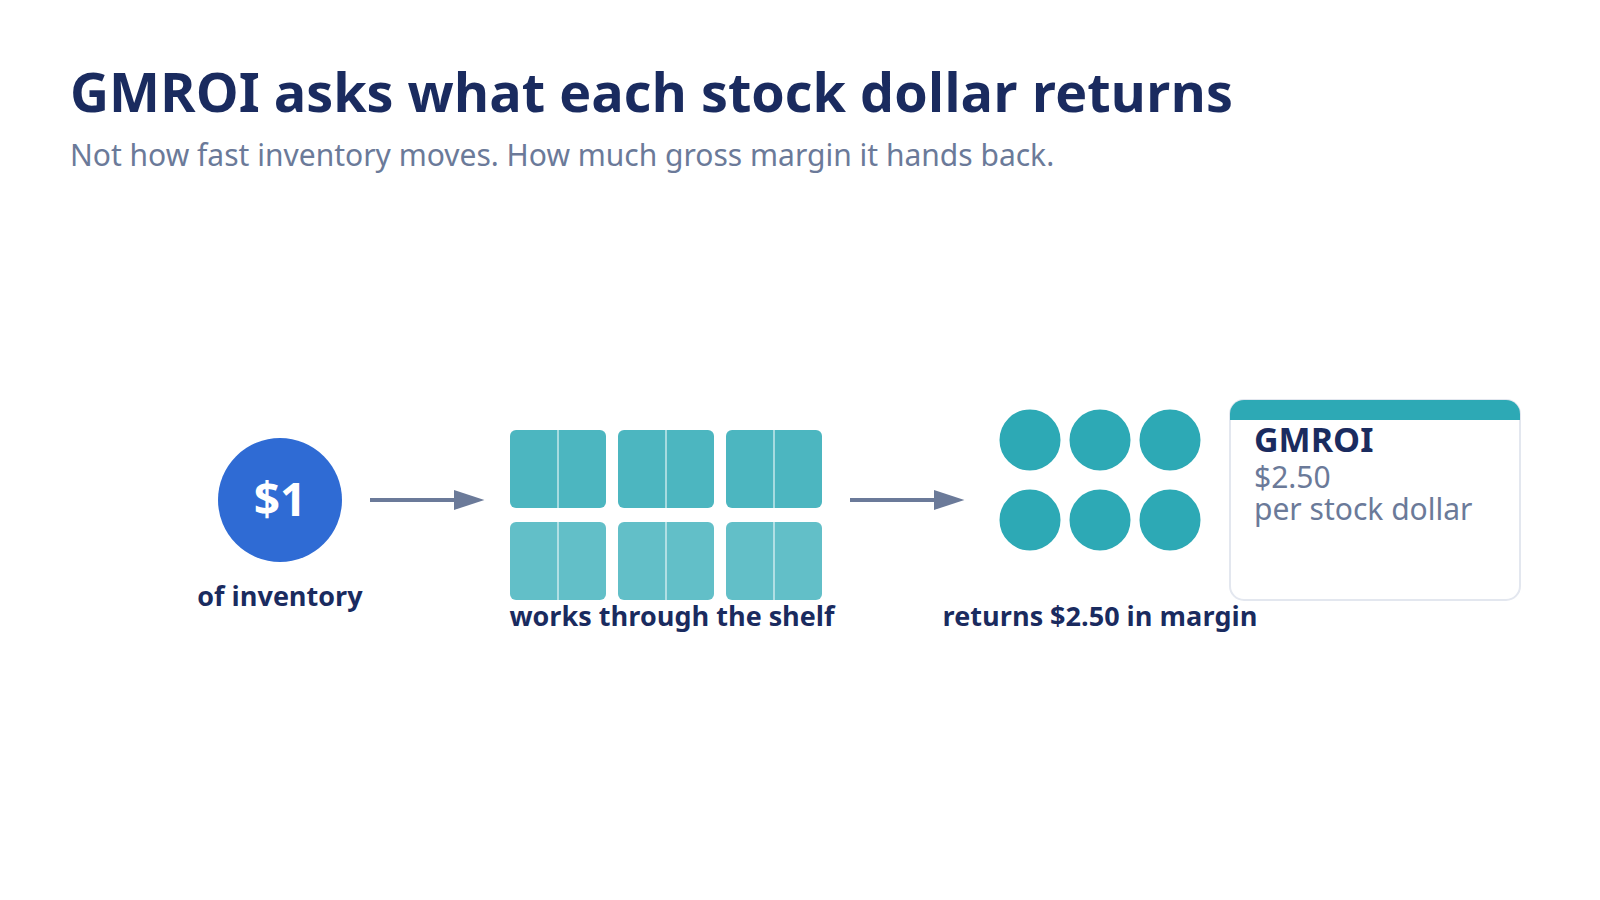
GMROI shows how much gross margin every dollar in inventory returns. Learn the GMROI formula, what a healthy score looks like, and two levers to improve it.
Two products sell the same $10,000 in gross margin this year. One does it on $4,000 of average inventory. The other needs $12,000 sitting on the shelf to pull off the same result. On the P&L they look identical. In your cash flow they're worlds apart. GMROI is the number that tells those two products apart, so you stop rewarding the one quietly eating your working capital.
GMROI (gross margin return on investment) measures how much gross margin profit you earn for every dollar tied up in inventory. You divide annual gross margin by average inventory cost. A GMROI of $3.00 means each dollar of stock returns three dollars of margin. It's the metric that connects what you buy to what that buy actually earns.
What is GMROI?
GMROI, short for gross margin return on investment, tells you how hard your inventory is working. It answers a question your revenue numbers can't: for every dollar you've locked up in stock, how much gross margin does that dollar bring back? A high GMROI means your shelves are paying rent. A low one means cash is napping.
The formula is simple:
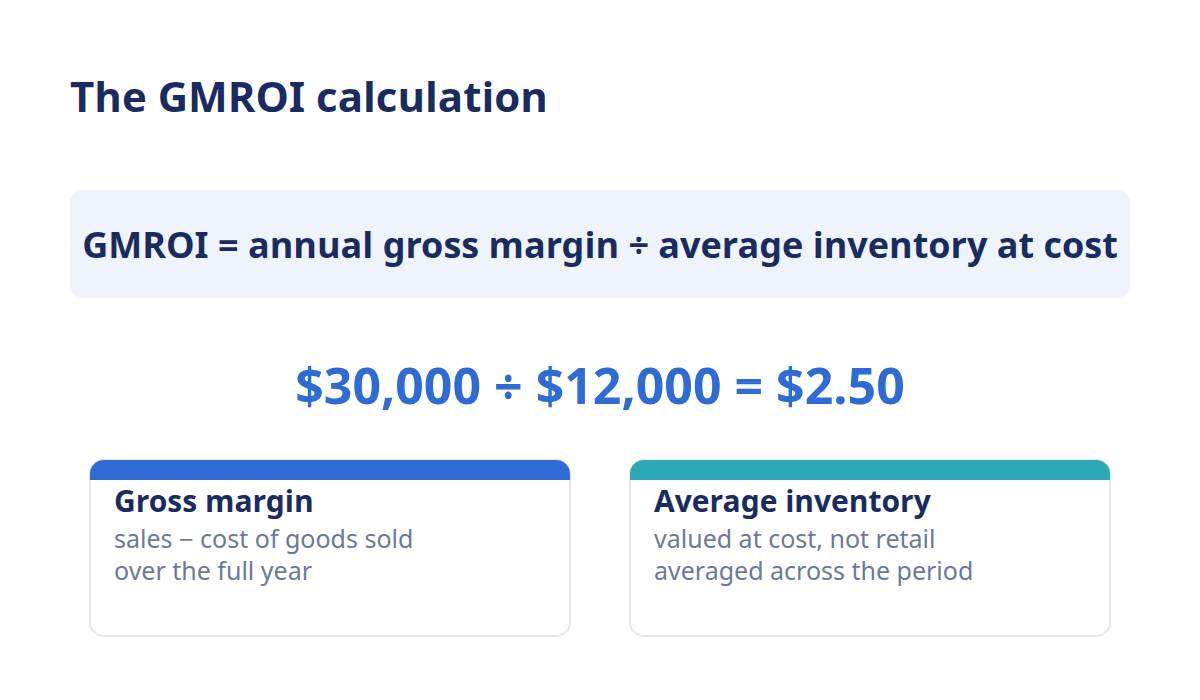
GMROI = annual gross margin ÷ average inventory cost
Gross margin is your sales minus the cost of goods sold. Average inventory cost is what you paid for the stock you carried on average across the year, valued at cost, not retail. Divide the first by the second and you get a ratio, usually read as a dollar figure. A GMROI of $2.50 says every dollar of inventory returned $2.50 in margin over the year.
Why does that matter more than plain margin percentage? Because margin percentage ignores the money you had to park to earn it. A 60% margin product looks great until you notice it sits for eight months before it sells. GMROI folds both halves together: how profitable the product is *and* how much cash it ties up to deliver that profit. That's why buyers and finance teams both lean on it.
A quick GMROI example
Say a SKU generates $30,000 in gross margin over the year, and you carried an average of $12,000 in inventory at cost. GMROI = $30,000 ÷ $12,000 = $2.50. Every dollar of stock returned $2.50 of margin. Run the same math on a slower SKU carrying $12,000 but throwing off only $9,000 in margin, and GMROI drops to $0.75. You're losing money on the capital that product ties up. Same shelf space, very different verdict.
GMROI is not the same as inventory turnover
Here's where planners trip: GMROI and inventory turnover are cousins, not twins. Turnover counts how many times you sold through and replaced your stock in a period, a volume signal. GMROI weighs the *profitability* of that movement, not just the speed. GMROI is the one that catches both.
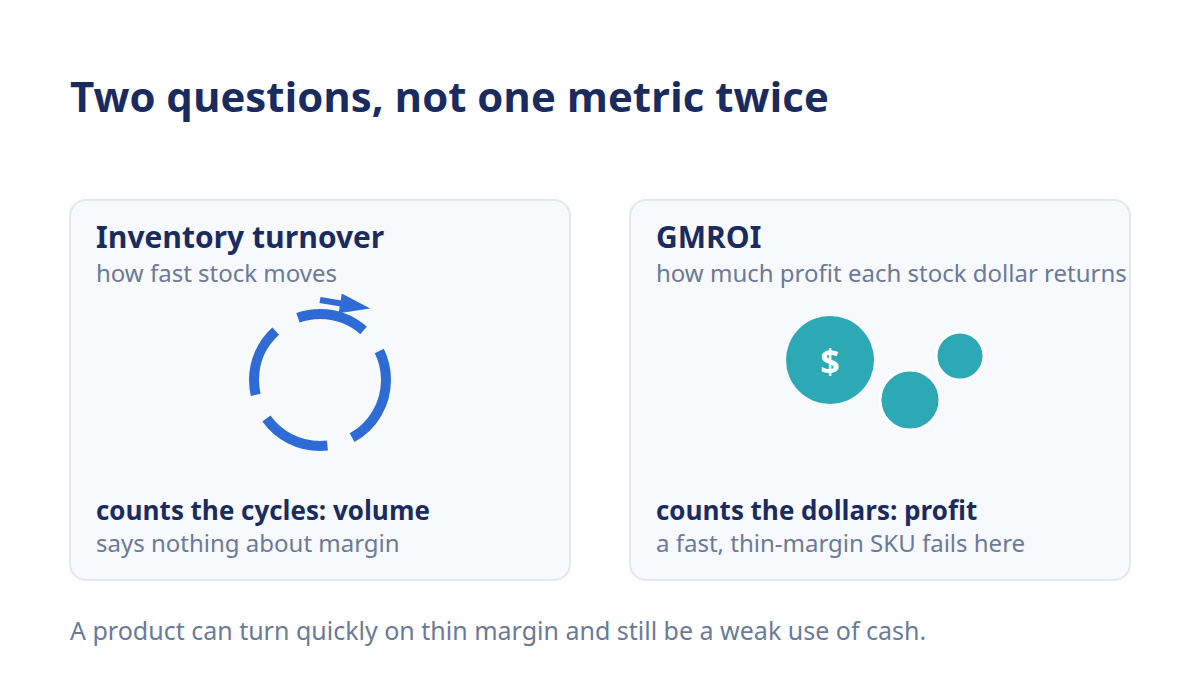
The two are linked, though. A product can turn fast and still return thin margin, or turn slowly at a fat margin. GMROI roughly equals your gross margin percentage multiplied by how fast inventory turns (measured at cost). So a product with modest margin can still post a healthy GMROI if it turns quickly enough, and a high-margin product that barely moves can post a weak one. If you want the full turnover math, the COGS-over-average-inventory ratio and what a healthy turn looks like, that lives in our guide on how to calculate inventory turnover. Read GMROI as the profit-weighted layer on top of it.
The practical takeaway: don't grade a buy on turnover alone. Fast turns feel productive, but if the margin's thin, you're just churning cash. GMROI keeps you honest by putting the dollar of profit back in the picture.
What is a good GMROI?
There's no single "good" GMROI, because a healthy number depends on your category, your margins, and your cost of holding stock. As a rough anchor, a GMROI above $2.00 to $3.00 is often cited as healthy, meaning each inventory dollar returns two to three dollars of margin. Below $1.00, a product returns less margin than the cash it consumes.
But the benchmark isn't the point. The useful move is comparing GMROI *across your own catalog*, not against an industry number you can't verify. Rank your SKUs by GMROI and the pattern jumps out: a handful of products carry the store, a long tail quietly drains it.
Context shapes what "good" means:
High-margin, slow-moving items (think premium or specialty SKUs) can post a fine GMROI even at low turnover, because the margin does the heavy lifting.
Low-margin, fast-moving items (basics, staples) rely on speed, they need to turn often to hit a decent GMROI.
Your holding cost sets the floor. The more it costs to carry stock, the higher your GMROI needs to be just to break even on the capital. That drag is the subject of our guide on inventory carrying cost.
Judge each SKU against products in its own lane, and against your own trend over time. A GMROI that's climbing quarter over quarter is often a better sign than a single number that clears some generic bar.
How do you improve GMROI?
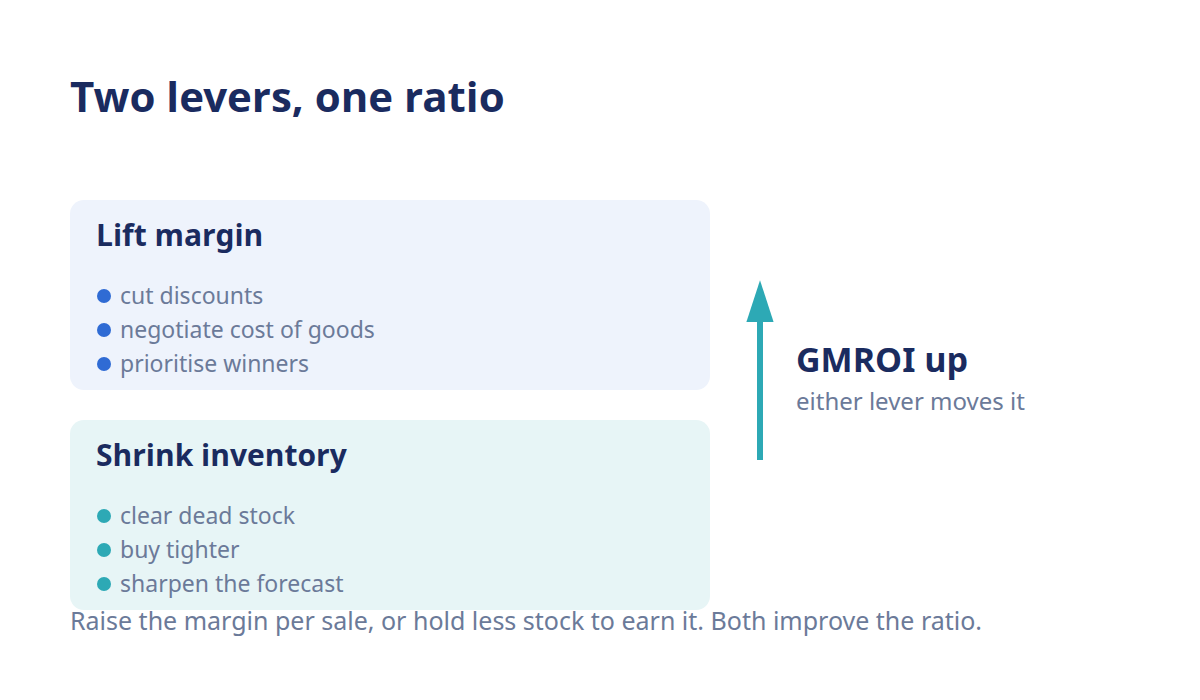
You improve GMROI by moving one of two levers: earn more gross margin, or tie up less inventory to earn it. Every practical tactic ladders up to one of those two. The fastest wins usually come from the denominator, cutting the dead stock that inflates average inventory without adding margin. Here's where to start.
Lift the margin side
The top of the ratio is your gross margin, so protecting it lifts GMROI directly.
Cut the discounting on healthy sellers. Every unnecessary markdown shaves the margin you're dividing by. Selling more at full price is the cleanest way to grow the numerator. Tracking sell-through rate, especially full-price sell-through, shows you which products can hold their price and which need help.
Renegotiate cost of goods. A point of cost savings on a high-volume SKU flows straight into gross margin. Volume and better supplier terms both help here.
Prioritize your winners. Put buying dollars and marketing behind the products that already earn strong margin, not the ones that merely look busy.
Shrink the inventory side
The bottom of the ratio is average inventory cost, and this is usually where the bigger, faster gains hide.
Clear the dead stock. Slow, aging inventory bloats your average inventory cost while contributing almost no margin. Marking it down to move it, even at a loss, frees the cash and lifts GMROI on the SKUs that remain.
Buy tighter. Ordering closer to real demand keeps less capital on the shelf. Right-sizing order quantities and reorder points means you're not carrying six months of stock to service six weeks of sales.
Improve forecast accuracy. Better demand forecasting is the quiet lever behind both sides. Forecast demand more accurately and you carry less safety stock, order closer to what actually sells, and strand less cash in inventory that won't turn.
That last point is where an AI-powered platform earns its keep. Doing this SKU by SKU across a growing catalog, spotting the low-GMROI drains, flagging the dead stock, right-sizing every buy, is more than a spreadsheet can hold. Conative's inventory planning platform surfaces which products are returning margin and which are tying up cash, and pairs demand forecasting with buying so you stock closer to real demand. That turns GMROI from a number you review after the quarter closes into one you can act on while the buy is still open.
The habit matters more than any single fix. Review GMROI by SKU on a regular cadence, act on the outliers at both ends, and the ratio tends to climb on its own.
Frequently asked questions
What is the GMROI formula?
The GMROI formula is annual gross margin divided by average inventory cost. Gross margin is your sales minus cost of goods sold, and average inventory is valued at cost, not retail. The result is a ratio read as a dollar figure, a GMROI of $2.50 means each dollar of inventory returned $2.50 in gross margin over the period.
What is a good GMROI?
A good GMROI depends on your category and margins, but a GMROI above $2.00 to $3.00 is often cited as healthy, meaning each inventory dollar returns two to three dollars of margin. Below $1.00, a product returns less margin than the cash it consumes. The most useful benchmark is comparing GMROI across your own catalog and over time.
What is the difference between GMROI and inventory turnover?
Inventory turnover counts how many times you sold and replaced stock in a period, a measure of speed. GMROI weighs the profitability of that movement, dividing gross margin by average inventory cost. A product can turn fast on thin margin or slowly at a fat margin, so GMROI catches profit where turnover only catches volume.
How do you improve GMROI?
You improve GMROI by earning more gross margin or tying up less inventory to earn it. Lift margin by cutting unnecessary discounts, negotiating cost of goods, and prioritizing your winners. Shrink inventory by clearing dead stock, buying closer to real demand, and improving forecast accuracy. The denominator, average inventory, usually offers the fastest gains.
Is a higher GMROI always better?
A higher GMROI is generally better, but chasing it to an extreme can backfire. Push inventory too lean to inflate the ratio and you risk stockouts and lost sales. GMROI is a balance metric, the goal is a healthy return on the cash you invest in stock while still keeping enough on hand to meet demand.
Should GMROI be calculated per SKU or for the whole catalog?
Both views are useful, but per-SKU GMROI is where the decisions live. A catalog-wide number tells you overall inventory health, while ranking individual SKUs by GMROI reveals which products carry the store and which quietly drain cash. Reviewing GMROI at the SKU level lets you act on outliers, reorder the winners, mark down the losers.