Tracking Signals: Knowing When a Forecast Has Drifted
A tracking signal flags when a forecast has drifted too far to trust. Learn the formula, the control limits that trigger a review, and how to monitor it.
You've got 4,000 SKUs and one afternoon. You can't sit and eyeball every forecast every week to check which ones are quietly drifting. A tracking signal does that watching for you. It's the smoke detector that pings when one forecast starts leaning the same way, week after week, and needs a human to look.
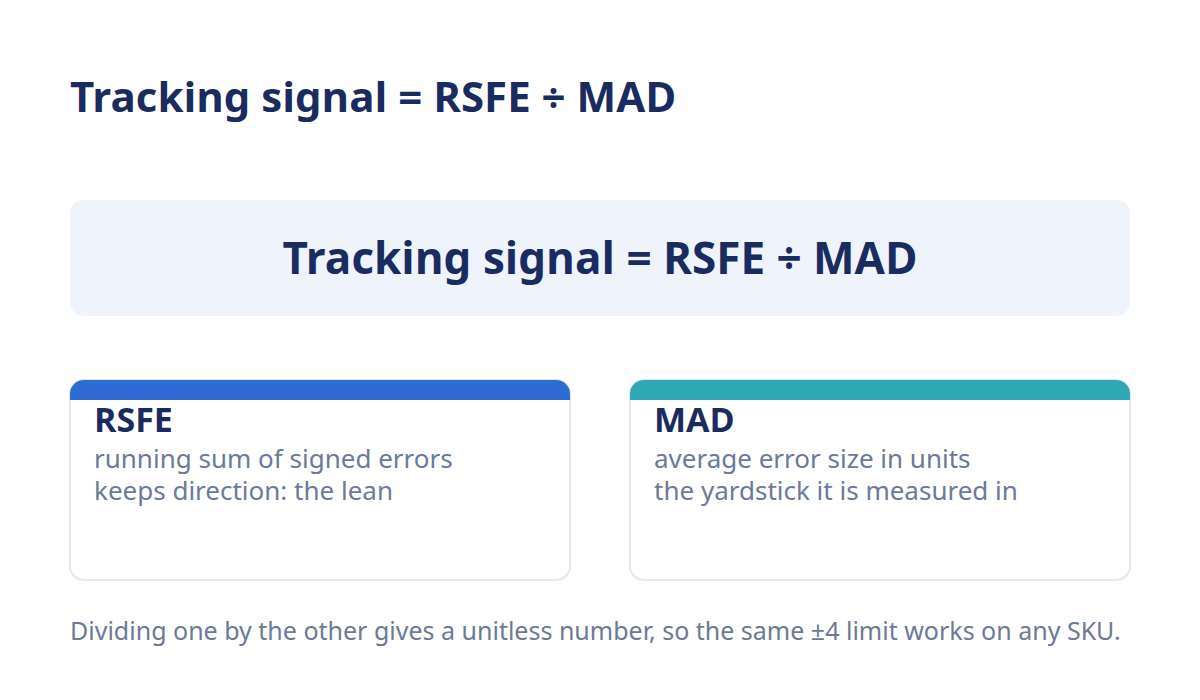
A tracking signal is an early-warning ratio that tells you when a forecast has drifted too far to trust. It's the cumulative signed forecast error divided by the mean absolute deviation (MAD). When the result crosses a control limit, commonly ±4, that forecast gets flagged for review. It turns bias detection into an automatic monitoring rule across your whole catalog.
What is a tracking signal?
A tracking signal watches whether your forecast errors are staying random or stacking up in one direction. Random misses cancel out over time. A forecast that's genuinely off keeps missing the same way, and the errors pile up instead of averaging to zero. The tracking signal catches that pile-up before it turns into overstock or a stockout.
The math is a ratio, and it's simpler than it looks. You take the running total of your signed errors, called the running sum of forecast errors (RSFE), and divide it by the mean absolute deviation (MAD). That's just the average size of your misses in units. MAD is the input here, so we won't re-derive it. If you need the walk-through, that's the MAD post's job.
Cumulative signed error ÷ MAD
RSFE keeps the sign on every error, so overs and unders can offset each other. If your forecast is unbiased, positive and negative misses roughly cancel and RSFE hovers near zero. If it leans one way, RSFE marches off in that direction. Dividing RSFE by MAD scales that drift against your typical error size, so the signal reads the same whether you sell 50 units a week or 5,000.
What the ratio is really measuring
The tracking signal answers one question: how many "average misses" of drift have accumulated in one direction? A reading of +3 means the cumulative error is three MADs above zero. Near zero, your errors are behaving. As the number climbs, the misses are no longer random. That's the tell. This is the automatic detector for the forecast bias you'd otherwise have to hunt for by hand.
What control limits flag a broken forecast?
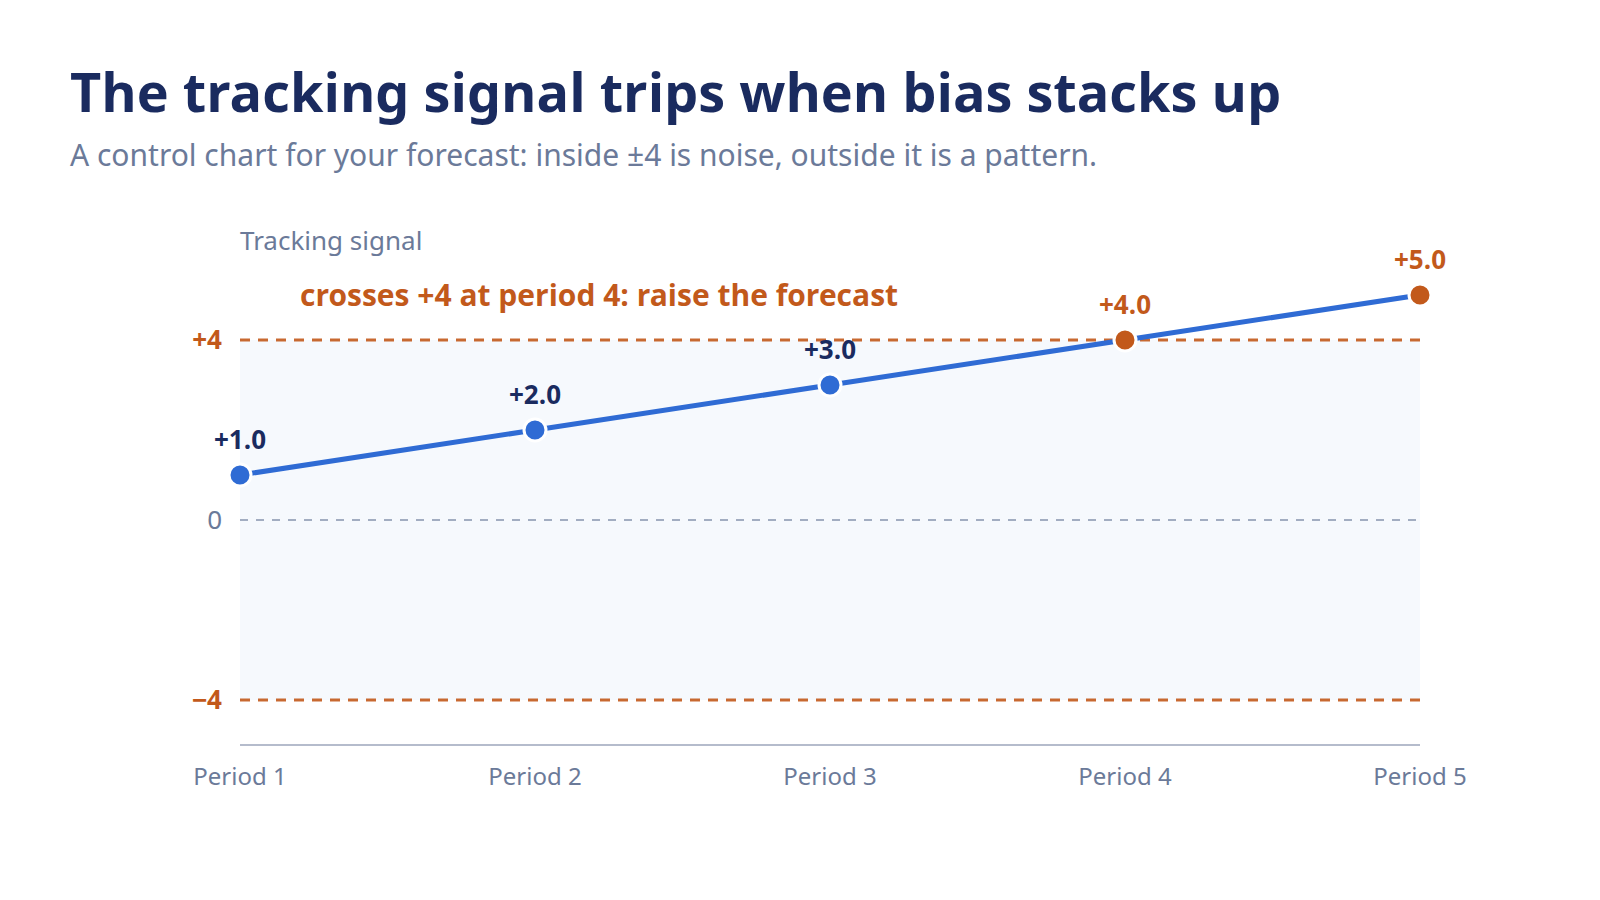
Most planning teams set the trip wire at ±4. Cross it in either direction and the forecast gets pulled for review. The exact number is a judgment call, not a law, but ±4 is the common default because it catches real drift without firing on ordinary noise. The right limit depends on the SKU.
Choosing limits: the ±3 to ±6 trade-off
Think of the control limit as a sensitivity dial. Set it at ±3 for critical, high-revenue SKUs where a quiet bias costs you real money and you want to know early. Loosen it toward ±5 or ±6 for the long tail, where lumpy demand throws off false alarms and you don't want a hundred flags you'll never action. There's no universal right answer. Match the tolerance to what the SKU is worth to you.
What to do when a SKU trips
A tripped signal isn't a verdict. It's a "come look at this." When a SKU crosses the limit, check the direction first. A positive tracking signal means you keep under-forecasting, so demand is outrunning your model and a stockout is building. A negative one means you keep over-forecasting, and overstock is quietly accumulating. Then fix the cause, not the symptom, and reset the count once the forecast is corrected.
How do you monitor tracking signals over time?
You recalculate the tracking signal each period and watch the trend, not one lonely reading. A single number crossing ±4 might be a fluke. The same SKU climbing period after period is a pattern you can trust. Monitoring is about the direction of travel: is the signal settling back toward zero after a fix, or still marching outward?
Per-SKU monitoring at scale
Here's the honest problem. The tracking signal is easy for one SKU and brutal across thousands. Recalculating RSFE and MAD every period, for every product, in a spreadsheet, is exactly the kind of manual grind that never actually happens. So it doesn't get done, and the drift goes unnoticed until the warehouse or the out-of-stock report tells you the hard way.
Where AI flags drift automatically
This is where an AI-powered inventory planning platform earns its place. Instead of you running the ratio by hand, the platform recalculates tracking signals across the full catalog every cycle and surfaces only the SKUs that have tripped their limit. You spend the afternoon acting on the ten forecasts that broke, not rebuilding the math for four thousand that didn't. You can see how the forecast accuracy scoring handles this drift detection in practice. Less time recalculating, more time deciding what to buy.
A worked tracking signal example
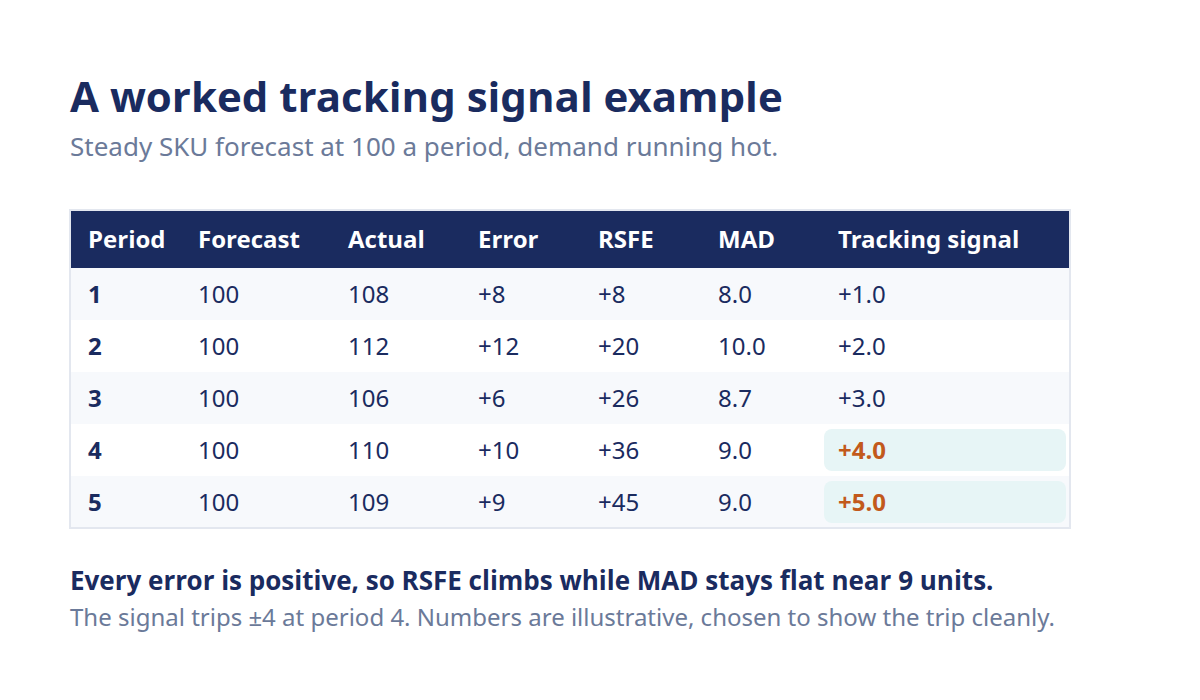
Say you're forecasting a steady SKU at 100 units a period, and actual demand keeps coming in a little higher. Each period you log the error (actual − forecast), keep a running total for RSFE, average the absolute errors for MAD, then divide. Watch what happens as the misses stack the same way.
- 1: forecast: 100; actual: 108; error (a − f): +8; rsfe: +8; mad: 8.0; tracking signal: +1.0
- 2: forecast: 100; actual: 112; error (a − f): +12; rsfe: +20; mad: 10.0; tracking signal: +2.0
- 3: forecast: 100; actual: 106; error (a − f): +6; rsfe: +26; mad: 8.7; tracking signal: +3.0
- 4: forecast: 100; actual: 110; error (a − f): +10; rsfe: +36; mad: 9.0; tracking signal: +4.0
- 5: forecast: 100; actual: 109; error (a − f): +9; rsfe: +45; mad: 9.0; tracking signal: +5.0
Every error is positive, so RSFE climbs while MAD stays roughly flat around 9 units. By period 4 the signal hits +4 and trips the ±4 limit. By period 5 it's at +5. The message is clear: this forecast is consistently low, demand is outpacing it, and a stockout is coming unless you raise the forecast now. (Numbers are illustrative, chosen to show the trip cleanly.)
Frequently asked questions
What's a normal tracking signal range?
A healthy forecast keeps its tracking signal bouncing around zero, roughly within ±4, as positive and negative errors cancel out. Values that stay near zero mean your misses are random, which is what you want. Once the number drifts consistently past your control limit, the forecast is leaning one way and needs a look.
What does a tracking signal of +5 mean?
A tracking signal of +5 means your cumulative forecast error is five MADs above zero, so you've been under-forecasting consistently. Actual demand keeps landing higher than your forecast, and those misses are stacking up rather than canceling out. Since +5 is past the common ±4 limit, that SKU should be flagged for review before it turns into a stockout.
Tracking signal vs forecast bias, what's the difference?
Forecast bias is the condition: error that consistently leans one direction. A tracking signal is the detector tool that measures whether that bias has grown large enough to act on. Bias is what you're looking for; the tracking signal is the automated rule that spots it and trips an alarm.
How often should tracking signals be recalculated?
Recalculate the tracking signal on the same cycle you plan and reorder, which for most eCommerce brands means weekly or monthly. Each new period of actual sales updates RSFE and MAD, so the signal reflects your latest results. Frequent recalculation catches drift early, while checking too rarely lets a biased forecast run for months unnoticed.
Can you automate tracking signals?
Yes, and across a large catalog you almost have to. Running the ratio by hand for thousands of SKUs each period rarely gets done consistently. AI-powered inventory planning platforms recalculate tracking signals automatically every cycle and surface only the SKUs that have crossed their control limit, so your team reviews the handful that actually broke.
What MAD do you use in the tracking signal?
You use the mean absolute deviation of the same forecast you're monitoring, calculated over the periods in your tracking window. MAD is the average size of the absolute errors in units, and it acts as the denominator that scales RSFE. Here it's an input only.