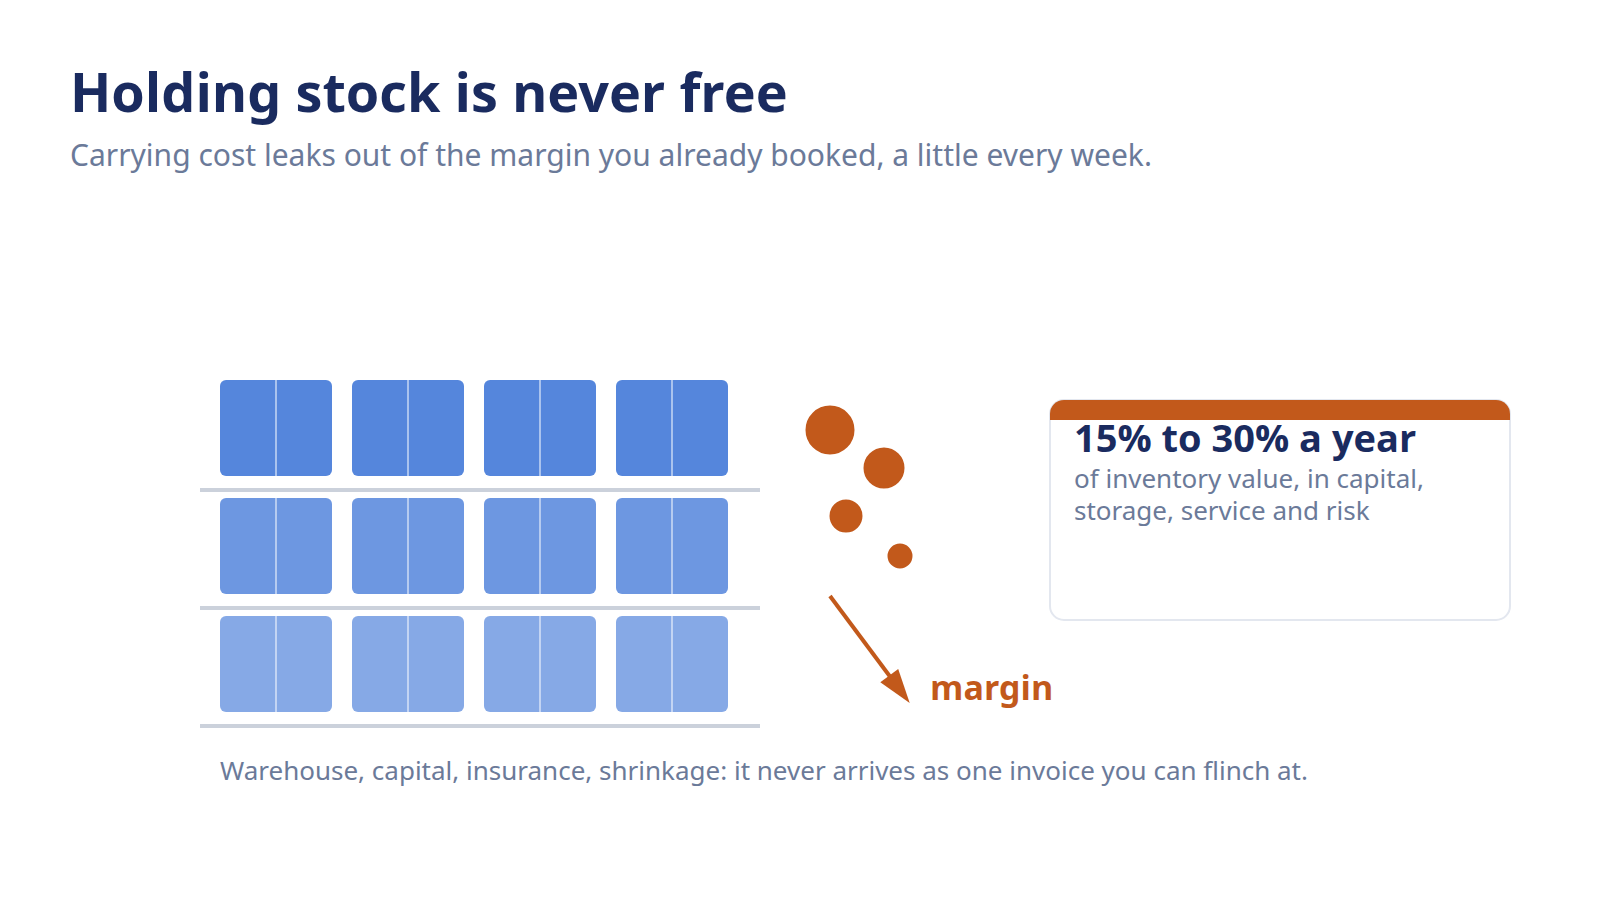
Forecast Bias: Why Your Forecast Leans One Way
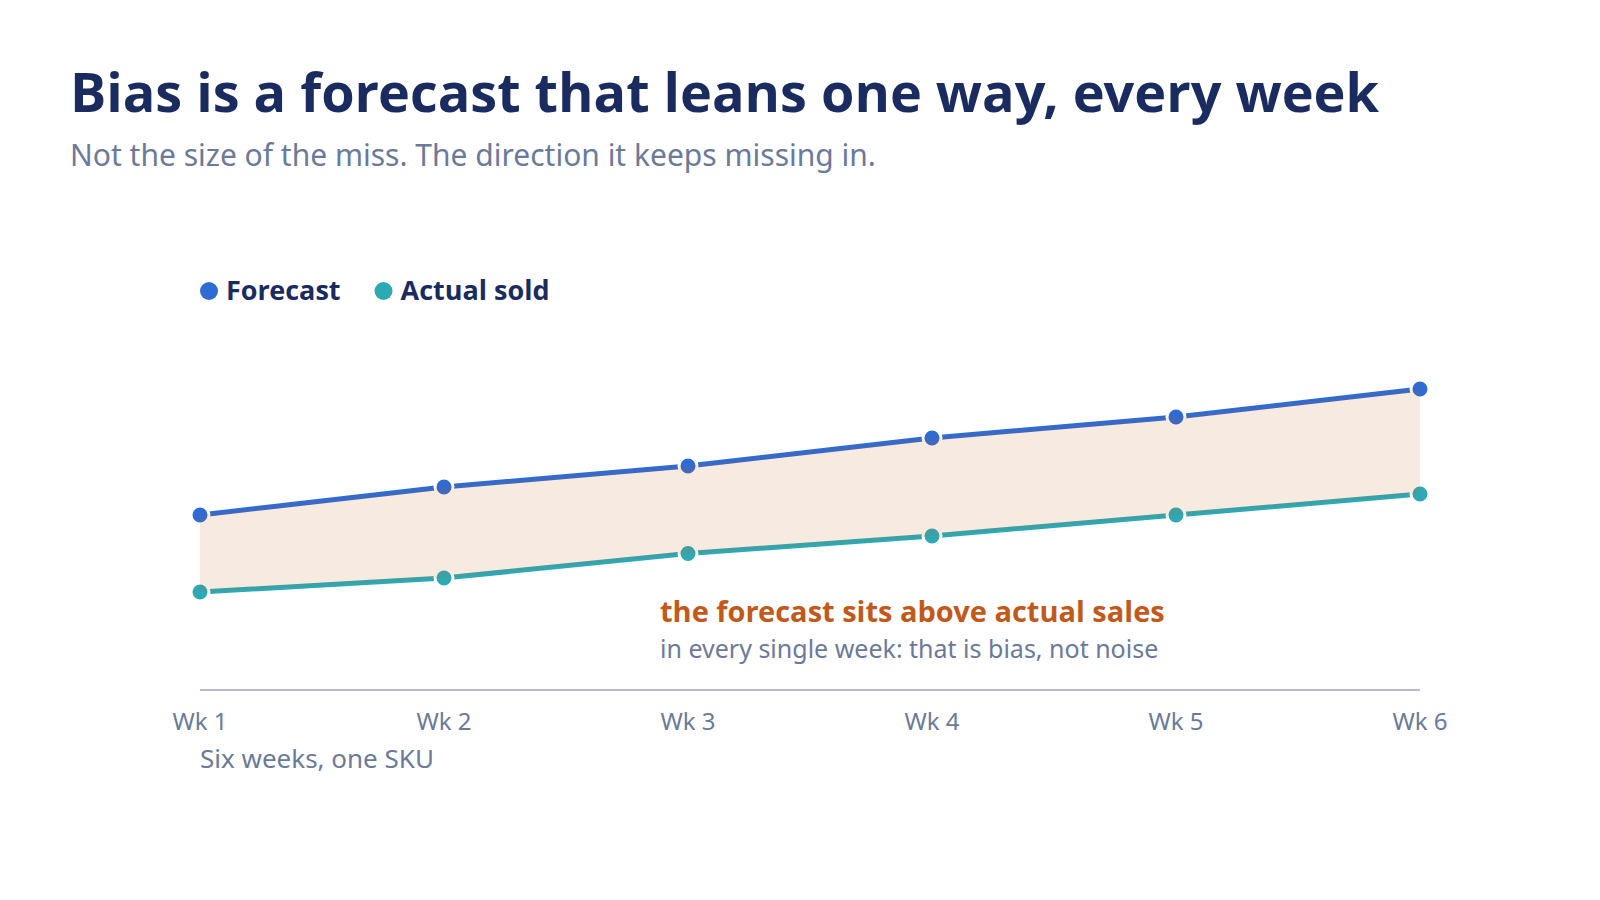
Forecast bias is error that leans one way, always high or always low. Learn how to detect over- and under-forecasting and correct bias before it builds overstock.
Your MAPE looks healthy. Leadership is happy with the accuracy number. Yet the warehouse keeps filling up, and every month you're expediting the same shortfalls on the same SKUs. That's not a random miss. That's bias, quietly hiding behind a score that only measures how big your errors are, never which way they lean.
Forecast bias is error that consistently leans one direction, you're always over-forecasting or always under-forecasting. Unlike MAPE or MAD, which strip out the sign, bias keeps it. A positive bias means you're quietly building overstock; a negative bias means recurring stockouts. You fix it by finding the lean and correcting the source, not by chasing a smaller error.
What is forecast bias?
Forecast bias is the tendency of your forecast to miss in the same direction over time. It's the signed forecast error added up across periods, so instead of asking "how far off were we?" it asks "which way do we keep tilting?" A forecast that runs high month after month has a positive bias, even when each miss looks small.
That sign is the whole point. Magnitude metrics like MAPE and MAD take the absolute value of every error, so a +30 in one period and a −30 in the next cancel to a clean-looking average. Bias refuses to let them cancel. It sums the raw, signed errors and shows you the drift that magnitude metrics are built to ignore.
Over-forecast vs under-forecast, and what each costs
The direction of your bias tells you which problem you're paying for. Get both wrong and you're bleeding cash from two ends.
- Positive bias (over-forecasting): you consistently predict more demand than shows up. You buy too much, tie up cash, and pile up stock that ends in a markdown. It's the quiet one, nobody escalates an overstock the way they escalate a stockout, so it compounds.
- Negative bias (under-forecasting): you consistently predict less demand than shows up. You run out of best-sellers, lose sales, and send customers to a competitor. It's the loud one, and it trains your team to over-order to compensate, which just flips you into positive bias.
Neither is "safe." They're two sides of the same broken assumption, and both trace back to a forecast that never gets corrected because the accuracy score never flags it.
Bias vs accuracy: a forecast can be accurate yet biased
Here's the part that trips up most planners. A forecast can post a perfectly respectable accuracy score and still be biased. Accuracy, as covered in what forecast accuracy is and how to measure it, tells you the *size* of the average miss. Bias tells you the *direction*. They're different questions, and one can look great while the other quietly costs you money.
Picture a SKU where you over-forecast by 40 units in a high week and under-forecast by 40 in a low week. Your average absolute error looks moderate, so the dashboard stays green. But if the pattern is really "high every peak, low every trough," that's a structural lean your accuracy metric will never surface. You can't fix what your main number is designed to hide. That's why planners track bias alongside magnitude, not instead of it.
How do you detect forecast bias?
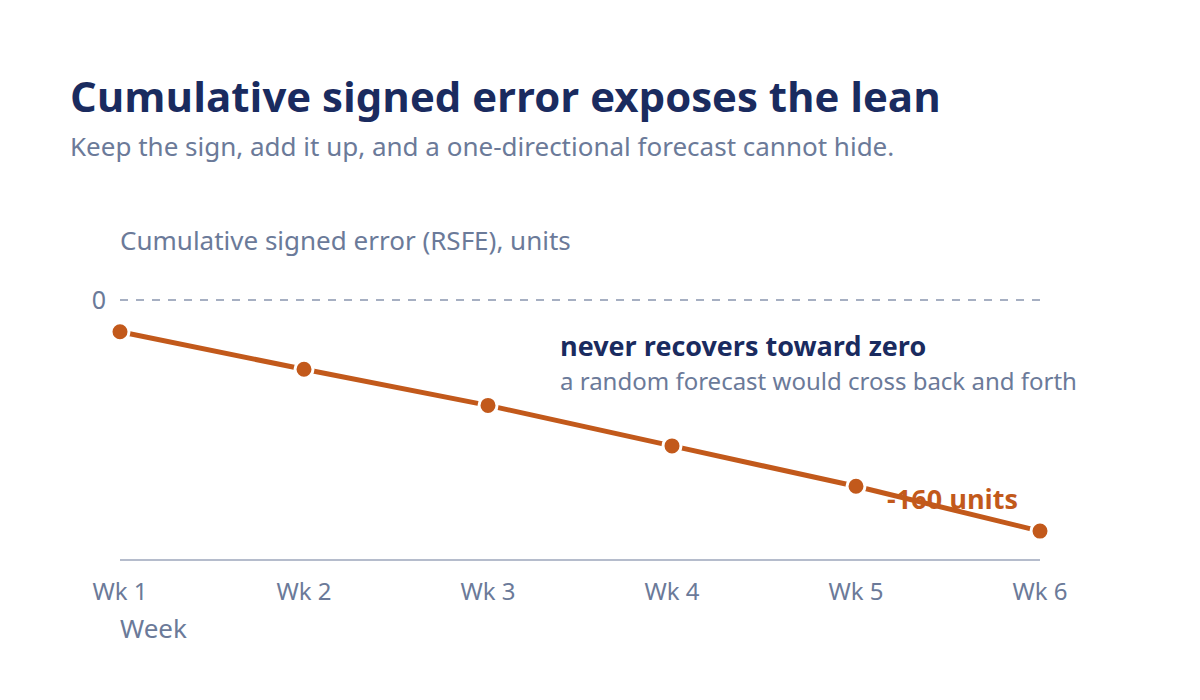
You detect forecast bias by summing the signed errors over a window and watching whether the running total drifts away from zero. If errors are truly random, the pluses and minuses roughly offset and the sum hovers near zero. If the sum keeps climbing or keeps falling, your forecast is leaning, and the drift's direction tells you which way.
The read most planners use is the cumulative signed error, sometimes called the running sum of forecast errors (RSFE). You calculate the error each period as actual minus forecast, keep the sign, and add it to a running total. A total that wanders around zero is healthy. A total that marches steadily in one direction is bias you can see building.
Here's an illustrative six-week run for one SKU. Numbers are made up to show the shape, not a real product.
- 1: forecast: 120; actual: 108; signed error (actual − forecast): −12; cumulative signed error (rsfe): −12
- 2: forecast: 120; actual: 111; signed error (actual − forecast): −9; cumulative signed error (rsfe): −21
- 3: forecast: 125; actual: 118; signed error (actual − forecast): −7; cumulative signed error (rsfe): −28
- 4: forecast: 125; actual: 112; signed error (actual − forecast): −13; cumulative signed error (rsfe): −41
- 5: forecast: 130; actual: 119; signed error (actual − forecast): −11; cumulative signed error (rsfe): −52
- 6: forecast: 130; actual: 116; signed error (actual − forecast): −14; cumulative signed error (rsfe): −66
Every single week the error is negative, and the cumulative total slides from −12 to −66 without ever turning back toward zero. That one-directional slide is the signature of bias. In this case the actuals keep landing below the forecast, so you're over-forecasting demand and steadily building the overstock you'll be marking down later.
The cumulative signed error is the read
The value of the running total isn't the exact figure, it's the trend. One negative week is noise. Six negative weeks stacking into a −66 slide is a signal. When the cumulative signed error trends firmly in one direction over a reasonable window, treat it as bias and go looking for the cause. When it zig-zags around zero, your errors are behaving like the random misses a forecast should have.
Want that read turned into an automatic trip-wire, one that flags the SKU the moment the drift gets too large to trust? That's the job of a tracking signal. It divides this cumulative error by your average error and fires when it crosses a control limit. This post owns the *concept* of bias and how to correct it; the tracking-signal tool that monitors it at scale is its own build.
Check bias by SKU, not just in aggregate
Aggregate bias lies the same way aggregate accuracy does. Roll every product into one company-wide number and the over-forecast on your winter line cancels the under-forecast on your summer line. The total looks unbiased while both categories are quietly wrong. Bias is most useful read at the level you actually buy. Check it per SKU, or at least per demand pattern, so the lean on a specific product can't hide inside the average.
How do you fix forecast bias?
You fix forecast bias by correcting the source of the lean, not by tightening the error. Chasing a smaller MAPE does nothing if the forecast keeps tilting the same way, you'll just be precisely wrong in a consistent direction. The fix is to ask *why* the forecast leans, remove that cause, and then confirm the drift has flattened out.
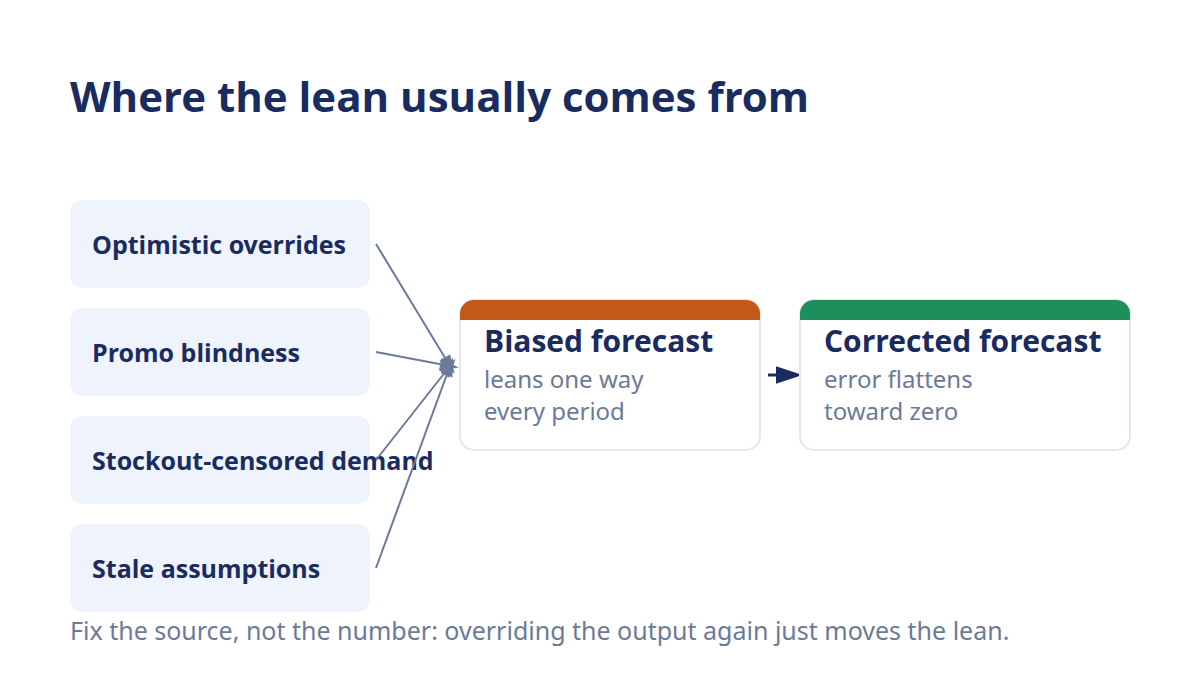
Most bias traces back to a handful of usual suspects. Find yours before you touch anything.
- Optimistic manual overrides. Someone bumps the forecast up every planning cycle "to be safe," and that thumb on the scale becomes a permanent positive bias. If a human always adjusts one way, that's a source, not a safeguard.
- Promo blindness. The forecast doesn't account for promotions, so demand spikes during a sale get baked in as the new normal, or the baseline ignores the lift entirely. Either way the model leans.
- Censored stockout demand. When a SKU stocks out, your sales history records low demand, but real demand was higher, you just couldn't fill it. Feed that censored history back into the forecast and it learns to under-forecast the very products that sell out. This is worth understanding on its own, because demand isn't the same as sales once a stockout clips the top off your actuals.
- Stale assumptions. A seasonal shape, a growth rate, or a base level set a year ago that no longer matches how the product actually sells now.
Work the list in that order. Pull the manual overrides that always lean one way. Model promotions explicitly instead of letting them pollute the baseline. Reconstruct demand for stockout periods so the model learns from what customers wanted, not just what you shipped. Refresh the assumptions that have gone stale.
Re-check after the fix
Correcting bias isn't one-and-done, because the whole point of bias is that it builds over time. After you make a change, keep watching the cumulative signed error for a few periods. If the running total starts drifting back toward zero and stays there, the fix held. If it's still marching in one direction, you treated a symptom and missed the real source, go back to the list. Bias correction is a loop, not a switch.
This is also where AI-powered demand forecasting earns its place. Manual bias correction is realistic on a handful of SKUs; it falls apart across a catalog of thousands. AI-powered models can reconstruct stockout-censored demand and weigh promotions and seasonality as signals rather than noise. They re-check the lean on every SKU each cycle, not just the few you have time to inspect. Conative's inventory planning platform tracks signed error by SKU and surfaces where your forecast is leaning, and you can see the underlying forecast accuracy capability for how the scoring works. The point is that a lean gets caught in the cycle it appears, not two quarters later when the overstock is already sitting on the shelf. Less time hunting drift in a spreadsheet, more time deciding what to buy.
Frequently asked questions
Can a forecast be accurate but biased?
Yes, and it's more common than planners expect. Accuracy metrics like MAPE and MAD measure the size of the average miss, not its direction. A forecast can post a solid accuracy score while consistently leaning one way, because opposite-signed errors cancel in the average. That's why you track bias alongside accuracy, never instead of it.
Is positive or negative bias worse?
Neither is safe, but they cost you differently. Positive bias (over-forecasting) builds overstock, ties up cash, and ends in markdowns, quiet and compounding. Negative bias (under-forecasting) causes stockouts, lost sales, and lost customers, loud and immediate. The right answer depends on your margins and your service-level priorities, so judge both against what each miss actually costs your business.
How do you measure bias as a percentage?
You can express bias as a percentage by dividing the cumulative signed error by total actual demand over the same window, then multiplying by 100. That gives a percentage bias that's comparable across SKUs of different sizes, so a lean on a high-volume product doesn't drown out a lean on a small one. Read it alongside the raw signed error, which stays in the units you buy.
What causes a consistently high forecast?
A consistently high forecast, positive bias, usually comes from optimistic manual overrides, an outdated growth assumption, or promotional lift baked into the baseline as normal demand. It can also come from a seasonal shape that no longer matches reality. The fix is to find which of these is leaning your forecast and correct that source, rather than trimming the whole forecast by a flat amount.
How often should I check for bias?
Check bias on the same cycle you plan and reorder, which for most eCommerce brands means weekly or monthly. Bias builds gradually, so frequent checks catch the drift while it's still cheap to correct, before it turns into a markdown or a stockout. Watch the cumulative signed error trend per SKU rather than a single reading, since one period tells you little.
Does AI forecasting reduce bias?
AI-powered forecasting can reduce bias by handling the sources that create it, reconstructing stockout-censored demand, modeling promotions as signals, and re-checking the lean on every SKU each cycle instead of a chosen few. It also removes the standing manual override that often causes bias in the first place. Each of those is a mechanical cause with a mechanical fix, which is why bias responds to a change of method rather than to trying harder.