Forecast Error: How to Measure It and What It Costs
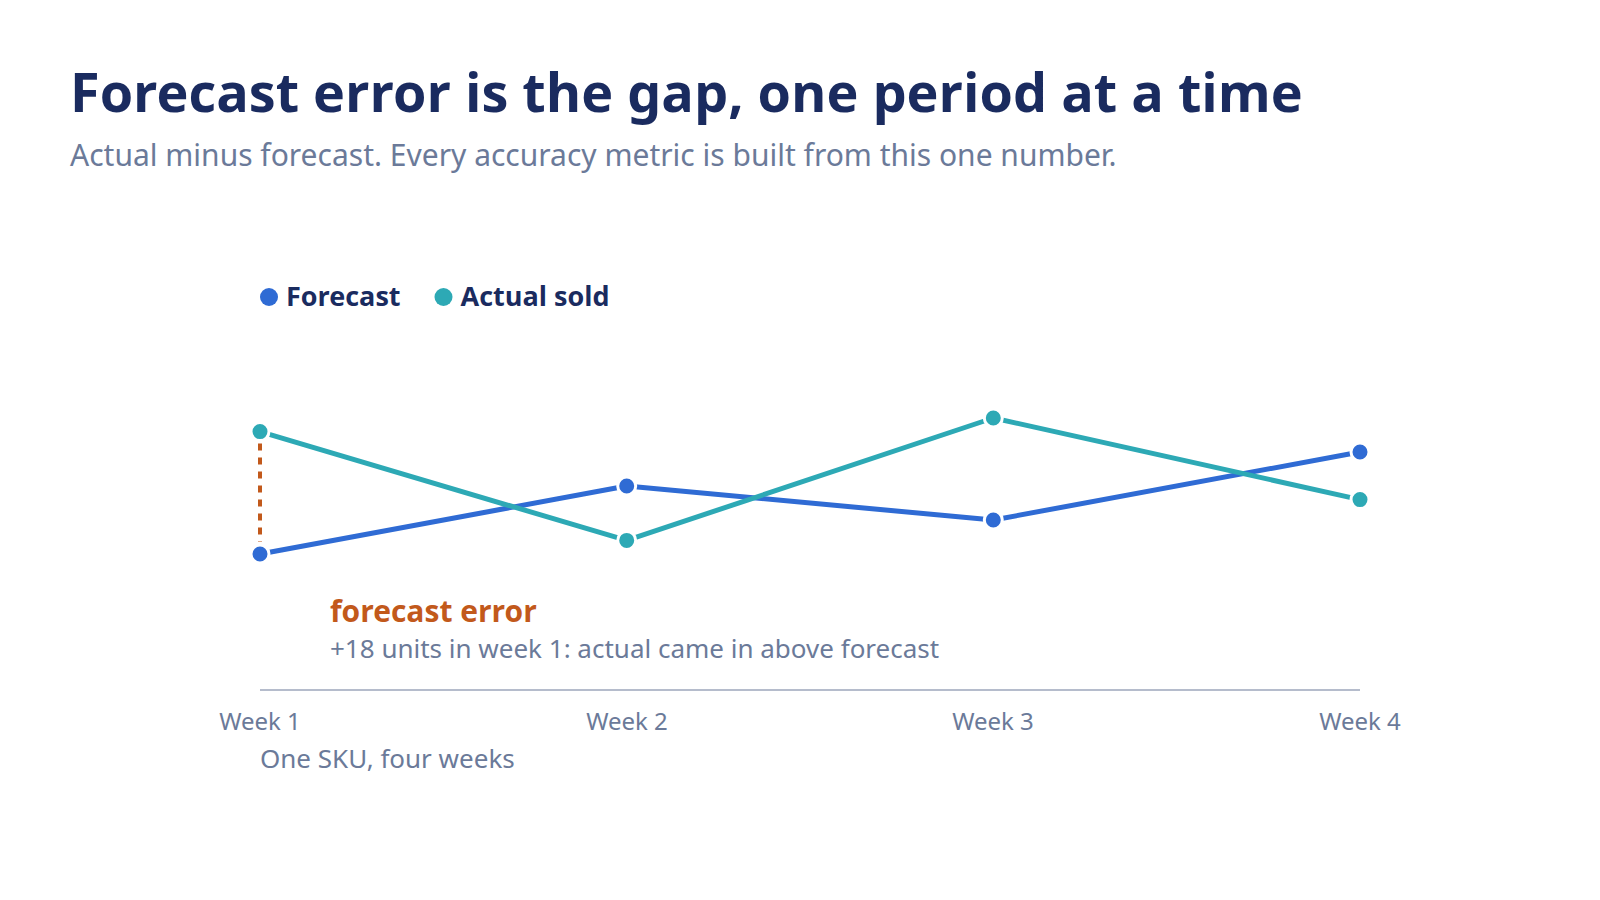
Forecast error is the raw gap between actual and forecast, the building block under every accuracy metric. Learn how to calculate it per period and as an error %.
Before MAPE, before MAD, before any dashboard your leadership asks for, there's one number sitting underneath all of it: how far off were you this period? You forecast 120 units, you sold 138, and that gap of 18 is the raw material every accuracy metric is built from. Get comfortable with it and the rest of the toolkit stops feeling like alphabet soup.
Forecast error is the raw gap between what actually sold and what you forecast for a single period, actual minus forecast. A positive error means you under-forecast; a negative error means you over-forecast. It's the single-period building block that every aggregate accuracy metric, from MAPE to MAD to RMSE, is calculated from.
What is forecast error?
Forecast error is the difference between actual demand and your forecast for one period, written as actual minus forecast. Statisticians call this the residual, the leftover the forecast didn't capture. It's a per-period number, not a score for the whole quarter. That's exactly why it's useful: it tells you the miss on this SKU, this week.
The sign matters as much as the size. Because you subtract forecast from actual, a positive error means real sales came in above your forecast, so you under-forecast. A negative error means sales came in below, so you over-forecast. That direction is the whole story on some SKUs. A pile of small positive errors quietly means you keep running short.
Error is the inverse view of accuracy
Error and accuracy are two ways of reading the same gap. Forecast error measures the miss in raw units; forecast accuracy measures the match, usually as a percentage. If you want the full picture of accuracy, how it's scored, and what a good score looks like, that's covered in our guide to forecast accuracy. Here we stay on the base number everything else is built from.
How do you calculate forecast error?
To calculate forecast error, subtract the forecast from the actual for each period, then decide whether you want the answer in units or as a percentage of actual. The unit version is your raw error. The percentage version, the error rate, lets you compare a miss on a high-volume SKU against a miss on a slow one.
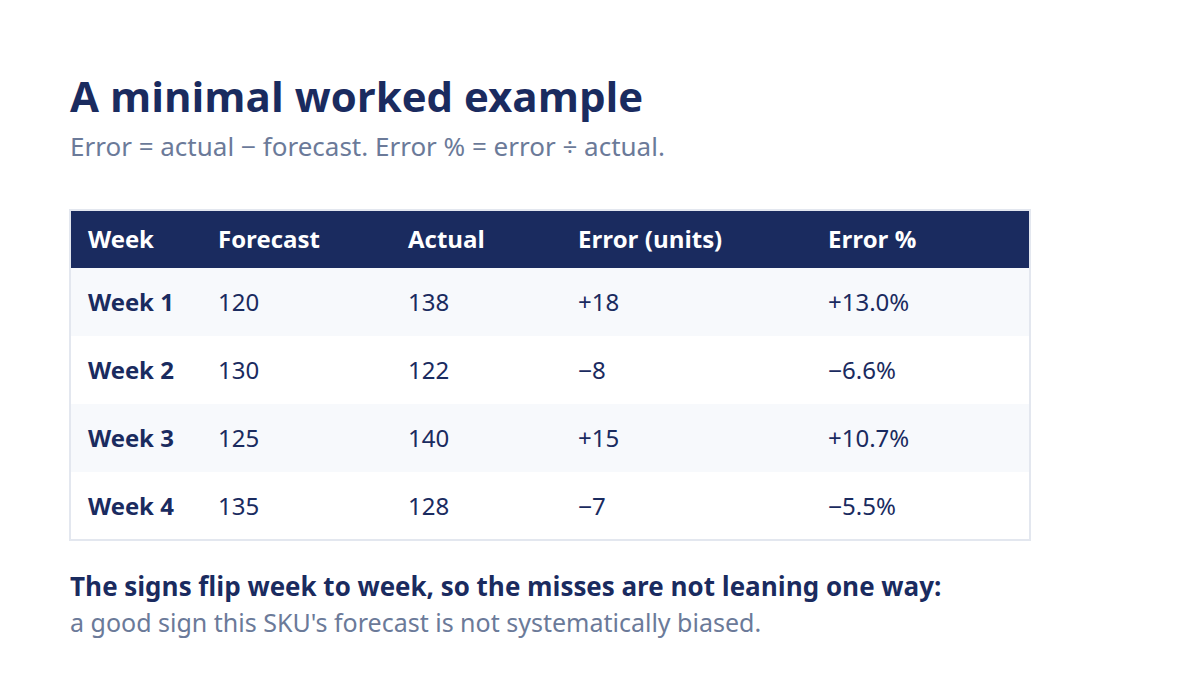
Here's a minimal worked example. Say you're tracking one SKU across four weeks. Forecast, actual, error (actual − forecast), and error % (error ÷ actual):
- Week 1: forecast: 120; actual: 138; error (units): +18; error %: +13.0%
- Week 2: forecast: 130; actual: 122; error (units): −8; error %: −6.6%
- Week 3: forecast: 125; actual: 140; error (units): +15; error %: +10.7%
- Week 4: forecast: 135; actual: 128; error (units): −7; error %: −5.5%
Read it row by row. Week 1, you under-forecast by 18 units. Week 2, you over-forecast by 8. The signs flip, which tells you the misses aren't all leaning one way on this SKU, a good sign your forecast isn't systematically biased.
Turning error into a percentage
The raw unit error is honest but hard to compare across products. An 18-unit miss is huge on a SKU that sells 20 a week and trivial on one that sells 2,000. Dividing the error by actual sales fixes that, it puts every SKU on the same scale so you can spot which forecasts are really drifting. One caveat: when actual sales are near zero, the percentage blows up, which is a known headache the aggregate metrics have to work around.
Why is forecast error the building block of every metric?
Every accuracy metric is just a different way of summarizing these raw per-period errors. Take the absolute value of each error and average it, and you're on the road to MAD and MAPE. Square each error before averaging, and you get RMSE. Keep the sign and add them up, and you're measuring bias. Same starting number, different math on top.
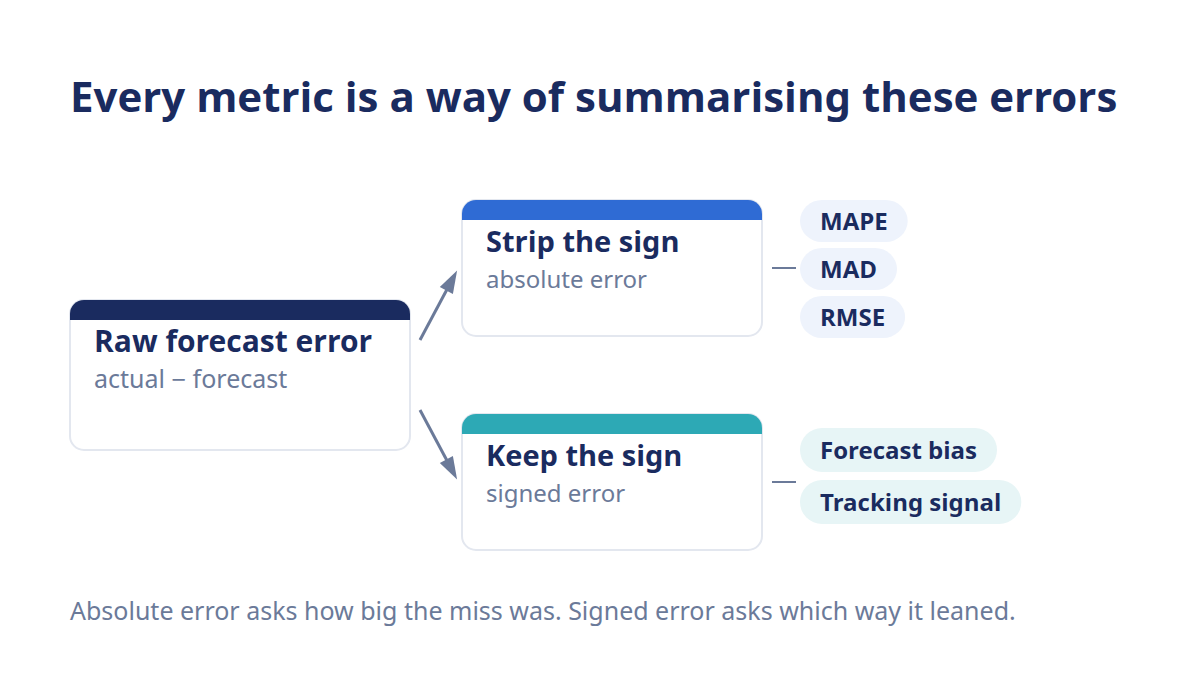
That's the part worth internalizing. You don't compute MAPE, MAD, and RMSE from scratch as three separate exercises. You compute the error once, then choose how to aggregate. Strip the sign and you get magnitude metrics like MAPE; keep the sign and the running total feeds bias detection and the tracking signal. If you're weighing which summary to trust, our forecast accuracy metrics comparison walks through when each one earns its place.
From error to the metric you actually report
There's a natural order here. Raw error is where you start. Absolute error, ignoring direction, rolls up into MAPE and MAD. Signed error, keeping direction, rolls up into forecast bias and its early-warning cousin, the tracking signal. Pick the summary that matches the question, magnitude of the miss, or which way it leans.
This is also where doing it by hand stops scaling. Calculating error for one SKU across four weeks is a coffee-break task. Doing it for 3,000 SKUs every week, then aggregating each one the right way, is not. AI-powered demand forecasting handles that grind, scoring error at the SKU level across the whole catalog. It surfaces the forecasts that are drifting, so you spend less time in the spreadsheet and more time deciding what to buy. You can see how that scoring works on Conative's forecast accuracy capability.
Frequently asked questions
Is forecast error actual minus forecast or forecast minus actual?
The common convention in demand forecasting is actual minus forecast. That way a positive error means you under-forecast and a negative error means you over-forecast, which matches how planners think about stock. Some textbooks flip it, so the sign convention matters most when you're feeding errors into bias or a tracking signal, just stay consistent across your whole catalog.
What is a residual in forecasting?
A residual is another name for forecast error: the part of actual demand your forecast didn't capture, calculated as actual minus forecast for a single period. The term comes from statistics, where it's the leftover after a model makes its prediction. In everyday planning, "error" and "residual" mean the same thing, so don't let the vocabulary trip you up.
How do you turn forecast error into a percentage?
Divide the error by the actual sales for that period, then multiply by 100. So a 15-unit error on 140 actual units is about 10.7%. The percentage, or error rate, lets you compare misses across SKUs of very different volumes. Watch out for near-zero actuals, though, dividing by a tiny number inflates the percentage and can make a small miss look enormous.
What's the difference between forecast error and forecast accuracy?
Forecast error is the raw gap between forecast and actual, measured in units or as a percentage. Forecast accuracy is the inverse view, how close the forecast came, usually shown as a percentage of the match. Error tells you the size and direction of the miss; accuracy tells you the match. You calculate accuracy from error, not the other way around.
Can forecast error be negative?
Yes, and the sign is meaningful. Using the actual-minus-forecast convention, a negative error means actual sales came in below your forecast, so you over-forecast that period. A positive error means you under-forecast. Magnitude metrics like MAPE and MAD strip the sign to measure the size of the miss, while bias and tracking signals keep it to reveal a consistent lean.
What do you do with the error once you have it?
Aggregate it into the metric that answers your question. Average the absolute errors for a magnitude read, keep the signed errors for direction. From there you act: a big magnitude points to a forecasting method problem, while a steady one-way lean points to bias you can correct. The raw error is the diagnosis; the metric you build from it is the treatment plan.