Forward Weeks of Supply (FWOS), Explained
Forward weeks of supply tells you how long current stock lasts at expected demand. Learn the WOS formula, a coverage target, and how FWOS differs from WOS.
"We've got plenty" is the most expensive sentence in inventory planning. Plenty for how long, exactly? Two weeks or two months? Until someone puts a number on it, "plenty" is just a feeling, and feelings don't reorder in time. Forward weeks of supply turns that gut read into a number you can actually plan a buy against. It's how sharp operators know when to sit tight and when to move.
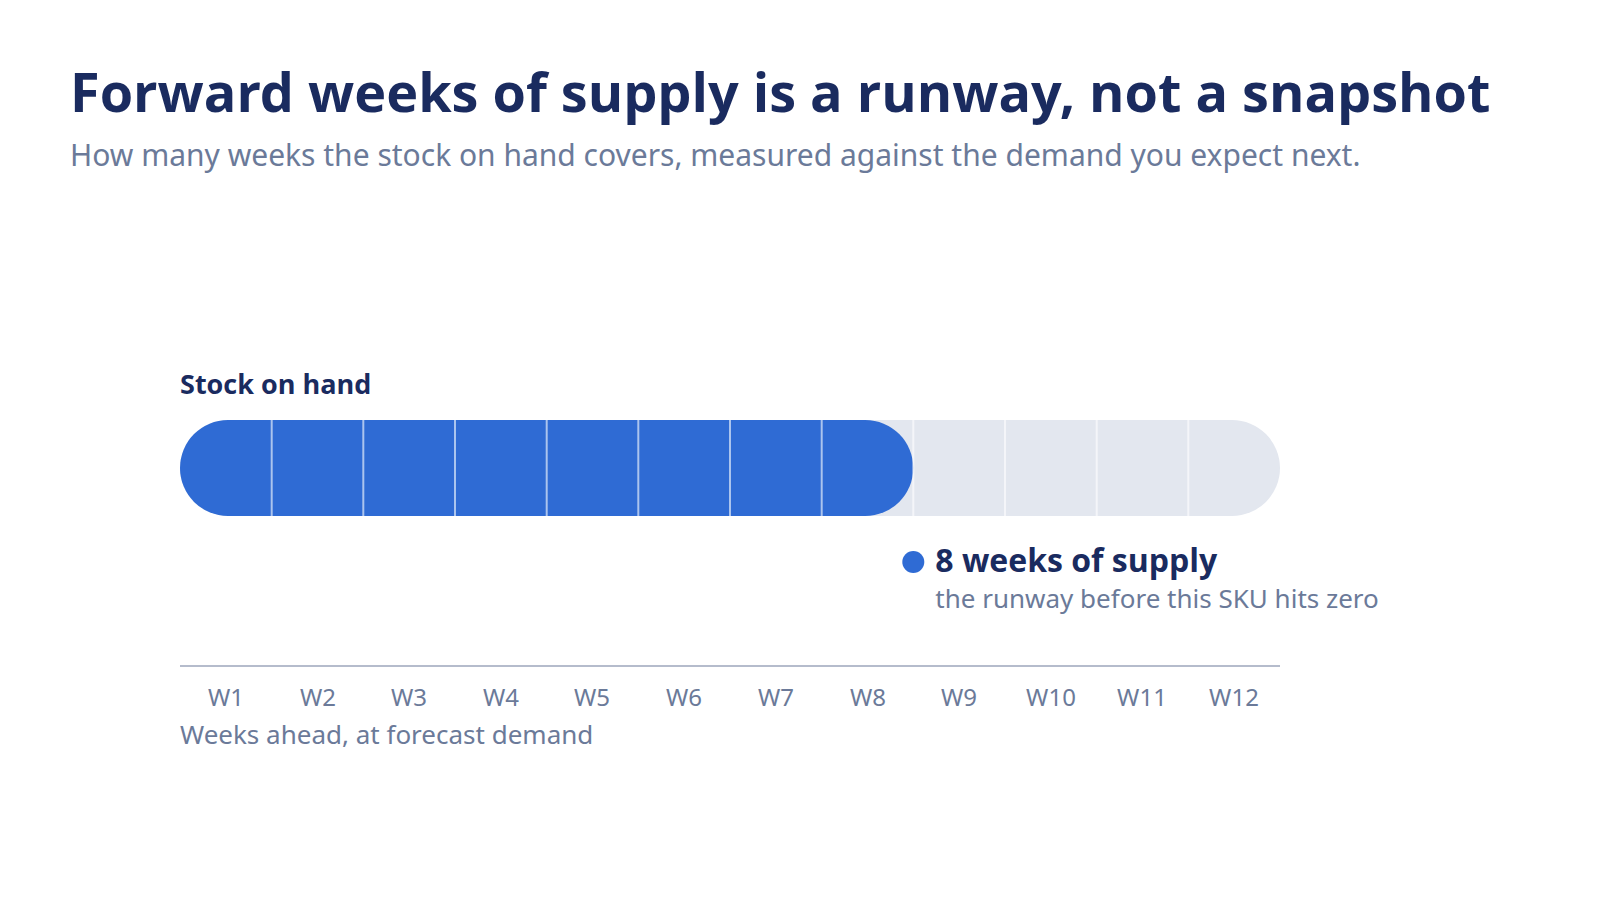
Forward weeks of supply (FWOS) tells you how many weeks your current on-hand stock will last based on *expected forward* demand, not just past sales. You calculate it as on-hand units ÷ average weekly demand. A low FWOS warns of a coming stockout; a high one warns of overstock, a fast coverage gauge for buying decisions.
What is forward weeks of supply?
Forward weeks of supply is a coverage metric: it measures how many weeks your current stock will last at the demand you expect going forward. Instead of asking "how much do I have," FWOS asks the more useful question, "how long will it last?" One number per SKU tells you whether you're comfortable or about to run dry.
The word doing the heavy lifting is *forward*. Plain weeks of supply usually leans on trailing sales, dividing what's on hand by what recently sold. That works fine when demand is flat. But FWOS bases the math on where demand is *heading*, your forecast. So it catches a SKU that's about to ramp before the shelf tells you the hard way.
FWOS vs WOS: forward-looking demand vs trailing
WOS and FWOS use the same shape of math; they differ on the demand number you feed in. WOS divides on-hand by recent average weekly sales, a rear-view read. FWOS divides on-hand by forecast weekly demand, a look through the windshield. On a stable staple, the two land in roughly the same place, so the distinction barely matters.
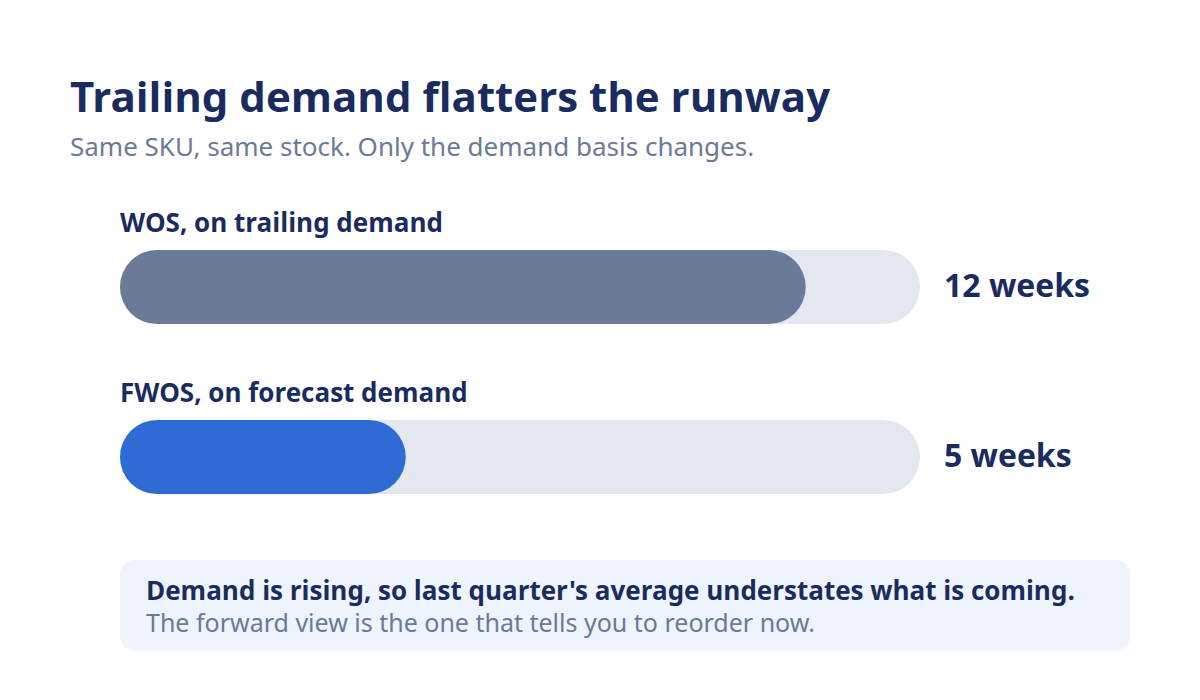
The gap opens up the moment demand isn't flat. Say a SKU sold 100 a week all spring but your forecast calls for 250 a week heading into peak. Trailing WOS says you're sitting comfortable; FWOS, doing the math on 250, says you're about to be short. That gap is the whole reason forward-looking coverage exists, it reflects tomorrow's demand, not yesterday's.
Why "forward" matters for seasonal and ramping SKUs
Trailing coverage quietly lies to you whenever demand is changing. A seasonal product coasting through its slow months looks over-covered right up until the season turns and the number collapses. A new launch finding its legs looks the opposite, dangerously thin on trailing math, fine once you plan on the forecast.
That's the whole case for forward-looking coverage. Your buys land weeks from now, against demand that's moved on from where it was. Grading today's stock against tomorrow's demand is the only honest way to know if you'll make it. Trailing coverage answers a question you already lived through.
How do you calculate weeks of supply?
The formula is refreshingly simple: weeks of supply = on-hand units ÷ average weekly demand. Take what's on the shelf, divide by what you expect to sell in a typical week, and the answer is how many weeks that stock covers. No Z-scores, no square roots, a number a planner can run in their head between meetings.
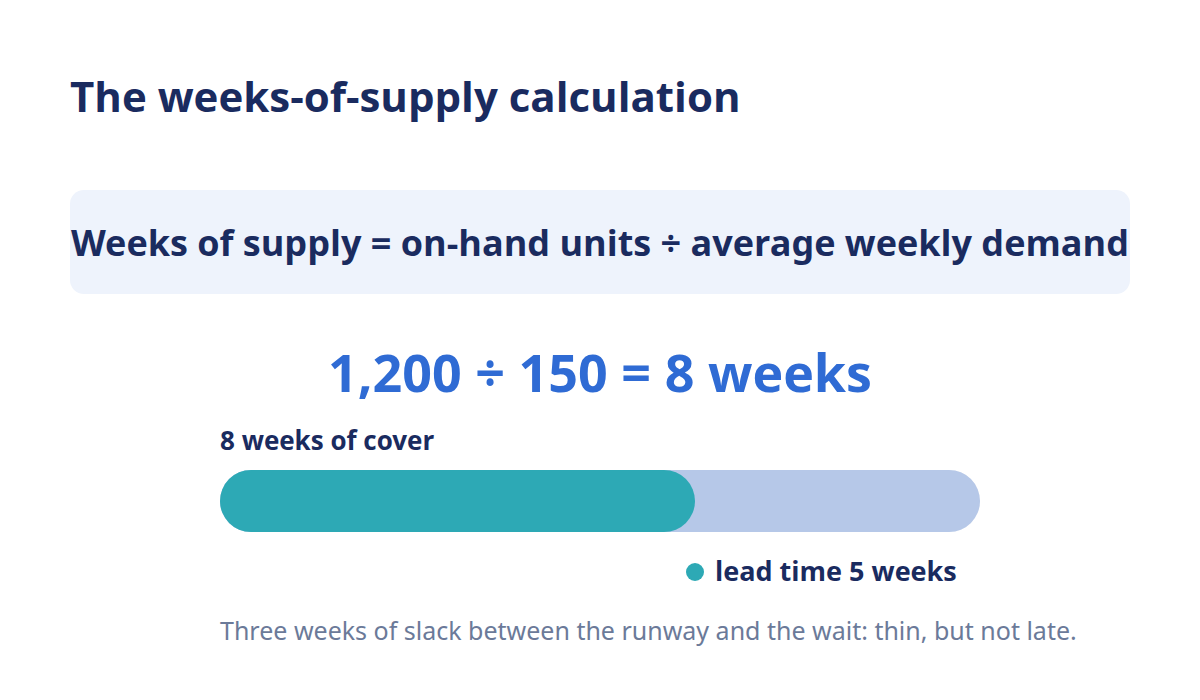
Here's a quick worked figure. Say a SKU has 1,200 units on hand and your forecast puts average weekly demand at 150 units. FWOS = 1,200 ÷ 150 = 8 weeks of supply. If your supplier's lead time is 5 weeks, those 8 weeks say you can hold off a little, but not long, because reorder-and-receive eats most of that runway.
Choosing the demand basis: trailing vs forecast
The formula never changes; the demand number you plug in is the real decision. Use trailing average weekly sales and you've calculated plain WOS. Use forecast weekly demand and you've calculated FWOS. For steady sellers, grab the trailing number, it's easy and close enough. For anything seasonal, promoted, or newly launched, use the forecast, or the coverage read will be wrong exactly when it matters most.
This is where forecast quality quietly decides how much you can trust FWOS. Feed it a shaky demand number and you get a confident-looking coverage figure built on sand. AI-powered demand forecasting keeps that weekly-demand input current across every SKU, so the coverage number reflects where demand is actually going. You can see how Conative AI turns forecasts into forward coverage on the inventory planning platform.
What's a healthy coverage target?
There's no universal "good" FWOS, the right target depends on your lead time plus the buffer you want on top. A sensible starting point is to cover your replenishment lead time and then some, so fresh stock lands before coverage runs out. Cover only the lead time exactly and one slow delivery tips you into a stockout.
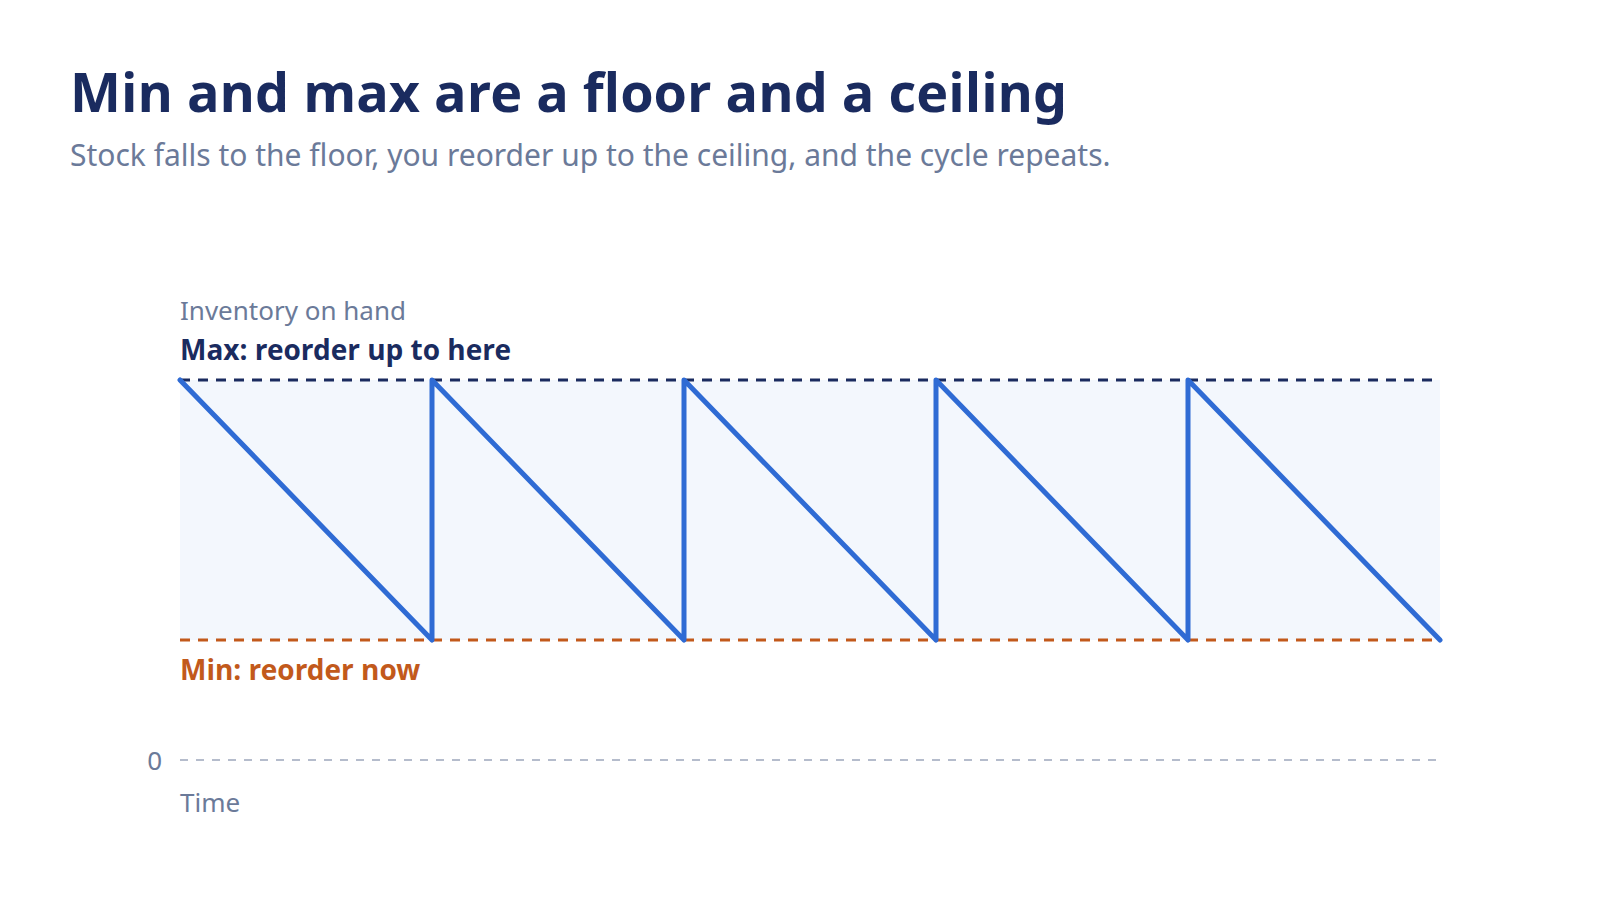
Setting the band is the practical move. Take your lead time in weeks, add a cushion for demand and supply swings, and you've got a lower FWOS limit, drop below it and it's time to order. Add a ceiling too, above which you're just tying up cash in stock that sits. FWOS is most useful as a range you defend, not a single fixed number.
Reading FWOS against your reorder point
FWOS and the reorder point answer the same "when to buy" question in two currencies. FWOS speaks in weeks of runway; the reorder point speaks in units on hand. When FWOS drops to your lead-time-plus-buffer floor, you're hitting the same trigger a reorder point fires on, just expressed as time instead of quantity. Many planners watch both, because weeks are easier to feel while units are easier to action.
The two are complementary, not competing. If you want the unit-level trigger and the math behind it, our guide to the reorder point covers when, not how much, to order. FWOS is the fast weekly scan; the reorder point is the precise fire-when-you-hit-this line. Use FWOS to spot the SKUs drifting toward trouble, then let the reorder point call the exact moment.
FWOS is not turnover or sell-through
It's easy to lump the coverage and efficiency metrics together, so a quick line to keep them straight. Inventory turnover is annualized, it measures how many times you sold through and replaced stock over a year, a backward-looking efficiency read. FWOS is forward and short-range, measured in weeks of runway ahead. They rhyme but answer different questions.
For the annual efficiency view, see our guide to inventory turnover. Sell-through is a third cousin worth separating too. Sell-through rate is the percentage of received units you've sold in a window, a look at how a buy is performing after the fact. FWOS doesn't grade a past buy; it projects how long what's left will last. If you're tracking these alongside each other, our inventory KPI overview shows where each one fits, and our guide to sell-through rate covers that metric in full.
Frequently asked questions
What's the difference between WOS and FWOS?
Both measure how many weeks your stock will last, but they use a different demand number. Plain weeks of supply (WOS) divides on-hand by trailing average weekly sales, a rear-view read. Forward weeks of supply (FWOS) divides on-hand by forecast weekly demand, a forward look. On stable SKUs they land in the same place; on seasonal or ramping ones, FWOS is the honest number.
Is weeks of supply the same as days of inventory?
They're the same idea measured in a different unit of time. Weeks of supply expresses coverage in weeks; days of inventory expresses the same runway in days. To convert, multiply weeks of supply by seven, or divide days of inventory by seven. Choose whichever cadence matches how you plan, weekly buyers tend to prefer weeks, faster-moving operations often think in days.
What's a good weeks-of-supply target?
There's no universal number, a healthy target covers your replenishment lead time plus a buffer for demand and supply swings. If your lead time is five weeks, a target band of roughly seven to ten weeks gives fresh stock time to land before you run dry. That buffer covers the gap without tying up excess cash. Set a floor that triggers a reorder and a ceiling that flags overstock, then defend the range.
How does FWOS relate to inventory turnover?
They measure related things at different time scales, so don't treat them as interchangeable. Inventory turnover is annualized, how many times you sold and replaced stock over a year, a backward-looking efficiency metric. FWOS is forward and short-range, measured in weeks of coverage ahead. Turnover tells you how efficient the year was; FWOS tells you how long the current stock will last.
Should FWOS use forecast or trailing demand?
Use forecast demand for anything seasonal, promoted, or newly launched, and trailing demand is fine for steady sellers. The whole point of the "forward" in FWOS is basing coverage on where demand is heading, not where it's been. Trailing math looks comfortable right before a season turns. When demand is changing, the forecast-based number is the one that keeps you from a surprise stockout.
How does FWOS flag overstock?
A high FWOS is your overstock warning light. If a SKU shows twenty-plus weeks of coverage when your target band tops out around ten, that stock is sitting far longer than it should. It ties up cash and runs up carrying cost. Watching FWOS against a ceiling, not just a floor, catches slow movers early, so you can slow the buy or plan a markdown before the stock goes stale.