ABC Analysis: How to Rank Your SKUs by Value
ABC analysis ranks your SKUs by value so you manage the vital few harder than the trivial many. Learn the Pareto logic, how to segment A/B/C, and what policy each gets.
You can't watch 4,000 SKUs with equal attention, and honestly, you shouldn't try. A handful of products carry your revenue while a long tail barely moves the needle. When every item gets the same treatment, you either overwork the trivial many or under-manage the vital few. ABC analysis fixes that. It sorts your catalog into a priority list, so your best hours land on the products that actually pay for them.
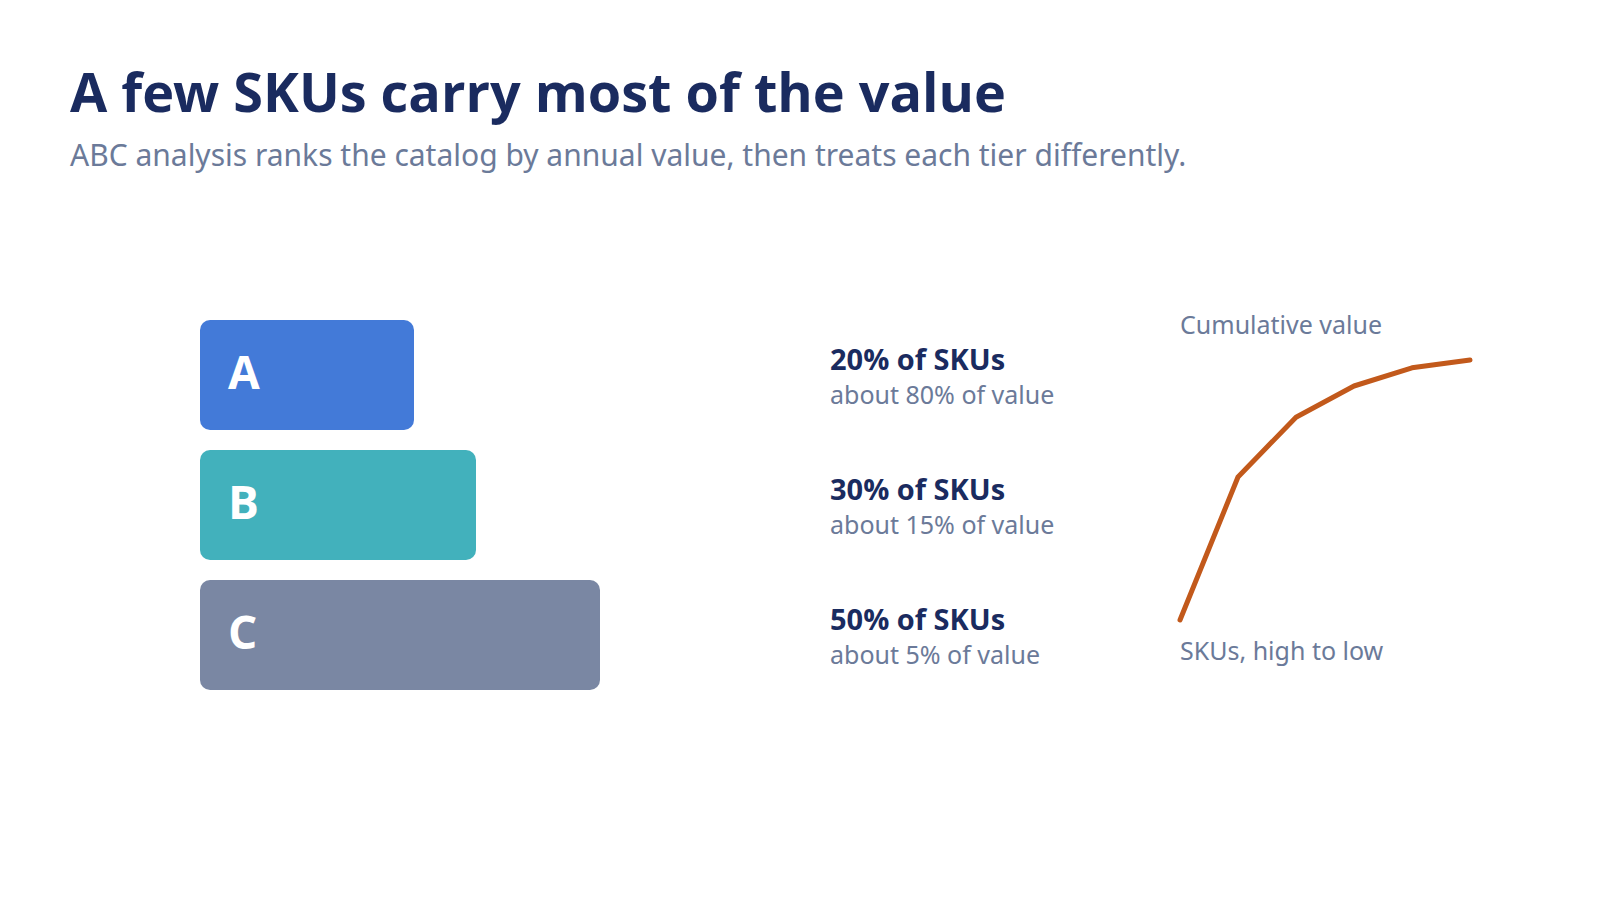
ABC analysis ranks your inventory by value so you can focus effort where it pays off. It applies the Pareto 80/20 rule: roughly 20% of SKUs (your A items) drive about 80% of revenue. So those A items earn the tightest controls, while B and C items get lighter policies. It turns a flat catalog into a priority list.
What is ABC analysis?
ABC analysis is a value-based inventory segmentation that sorts your SKUs into three classes by how much they contribute. It's built on the Pareto principle: a small share of items produces most of the value. So instead of managing every product the same way, you spend attention in proportion to what each one is worth.
Think of it as triage for your catalog. Some products deserve constant watching. Others can run on autopilot. ABC just makes that call explicit and repeatable, so it isn't riding on gut feel or whoever shouted loudest in last week's buying meeting.
The 80/20 logic behind ABC
The Pareto principle shows up everywhere in retail, and inventory is no exception. In most catalogs, roughly 20% of your SKUs generate around 80% of your revenue. Flip it around and the picture gets sharper: the bottom half of your product list often contributes a rounding error to the top line.
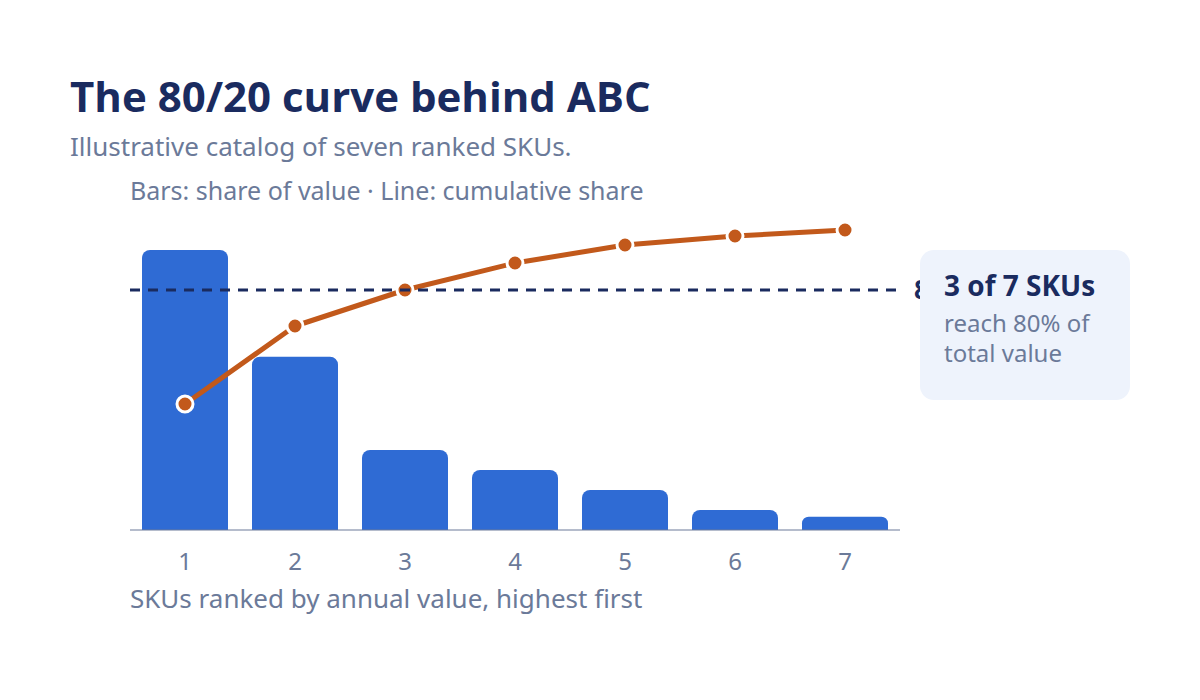
Those percentages aren't a law. Your split might be 25/75 or 15/85 depending on your assortment. The point isn't the exact ratio. It's the shape: value is lopsided, and pretending otherwise wastes effort. Your best-sellers are working overtime. The long tail is mostly along for the ride.
A, B, and C are effort tiers, not a grade
Here's the part teams get wrong. A C item isn't a bad product. It's a product that doesn't justify heavy planning. Plenty of C items are healthy, profitable, and worth stocking. They just don't need a weekly forecast review and a nervous buyer.
So read the classes as effort tiers:
A items are your revenue drivers. Tight controls, close attention, no room for a stockout.
B items sit in the middle. They matter, but they don't need daily eyes.
C items are the long tail. Keep them simple and cheap to manage.
The goal is to match management intensity to business impact. Nothing more.
How do you run an ABC analysis?
You run an ABC analysis by ranking every SKU by its annual consumption value, then adding up the cumulative percentage of total value as you go down the list. Then you draw cutoffs to split the ranked items into A, B, and C. Most teams use a rough 80/15/5 split, but the thresholds are yours to set.
It's a short exercise the first time, and it gets faster once you've done it. Here's the sequence.
The ranking steps
Work through it in order:
Pick your value metric. Annual consumption value is the common one: unit cost (or price) multiplied by annual units sold. That surfaces the products that move real money, not just the expensive ones sitting still.
Calculate value per SKU. Run the metric across your whole active catalog. A sales export from your store gives you the units; your cost or price list gives you the rest.
Rank high to low. Sort every SKU from most valuable to least.
Add a cumulative percentage. Walk down the list, adding each SKU's share of total value, and track the running total. The first few rows climb fast, then it flattens.
Draw the cutoffs. Where the cumulative line crosses your thresholds, that's your A/B/C boundary.
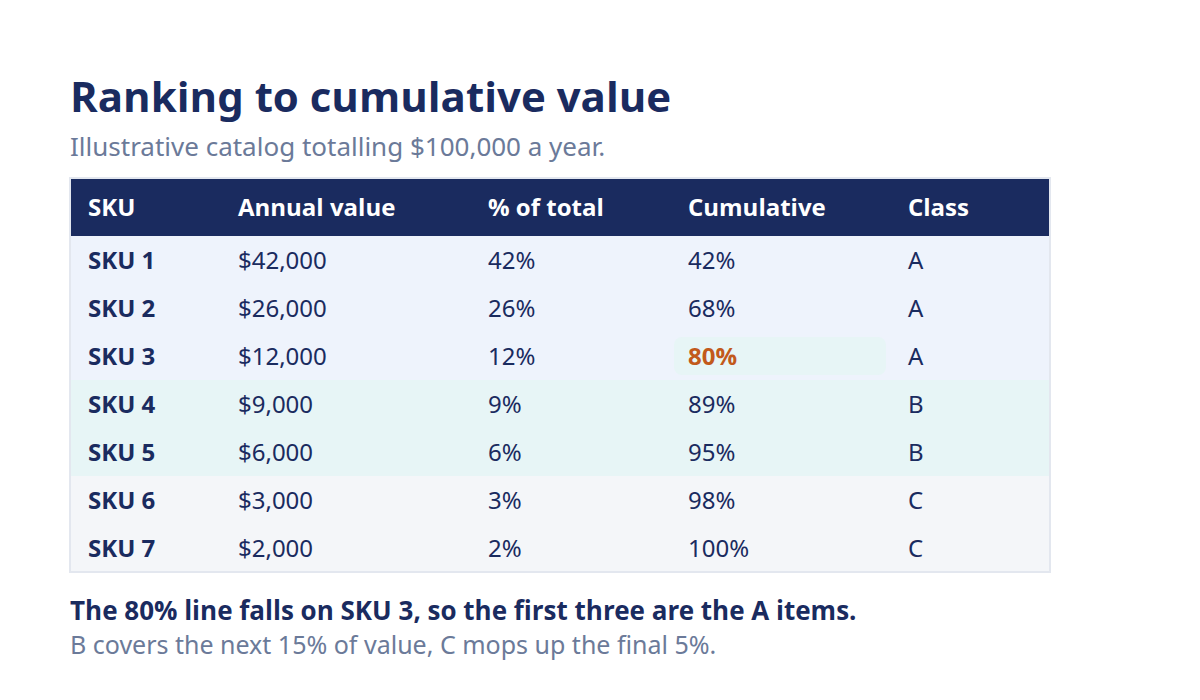
Here's a trimmed example so the cumulative logic is concrete. Real catalogs have thousands of rows, but the shape is the same:
- SKU-1: annual value: $52,000; % of total: 41%; cumulative %: 41%; class: A
- SKU-2: annual value: $30,000; % of total: 24%; cumulative %: 65%; class: A
- SKU-3: annual value: $19,000; % of total: 15%; cumulative %: 80%; class: A
- SKU-4: annual value: $11,000; % of total: 9%; cumulative %: 89%; class: B
- SKU-5: annual value: $7,000; % of total: 6%; cumulative %: 95%; class: B
- SKU-6: annual value: $4,000; % of total: 3%; cumulative %: 98%; class: C
- SKU-7: annual value: $2,500; % of total: 2%; cumulative %: 100%; class: C
Three SKUs carry 80% of the value here. That's your A group. The next two round it out to 95% as your B group, and the tail lands in C. Notice how fast the cumulative column front-loads. That's the Pareto shape doing the sorting for you.
Choosing your cutoffs
The classic split is 80/15/5. A items are the SKUs that make up the first 80% of cumulative value, B items cover the next 15%, and C items mop up the last 5%. It's a sensible default. It isn't gospel.
Some brands run 70/20/10 to widen the A tier when their revenue is less concentrated. Others tighten it. Set the lines where the natural breaks in your cumulative curve fall, then sanity-check the group sizes. If 60% of your SKUs land in A, your cutoff is too generous to be useful.
Rank by revenue, margin, or volume?
Revenue is the default, and it's a fine starting point. But it can mislead. A high-revenue SKU with a thin margin isn't as valuable as it looks, and a modest seller with a fat margin might deserve more love than its sales rank suggests.
That's why plenty of planners run ABC on margin contribution instead of raw revenue, so the classes reflect profit, not just top-line. Others rank by unit volume when the operational goal is picking and handling efficiency rather than dollars. There's no single right axis. Pick the one that matches the decision you're trying to make, and consider running two views if revenue and margin tell different stories.
How do you apply different policies per class?
You apply different policies per class by tightening controls as an item's value rises. A items get precise forecasting, frequent review, and higher service levels, because a stockout there costs the most. B items get lighter, periodic review on a slower cadence. C items get simple, hands-off rules with generous buffers, since managing them closely rarely pays off.
This is where ABC earns its keep. The classification is only useful if it changes what you actually do.
A policy-by-class playbook
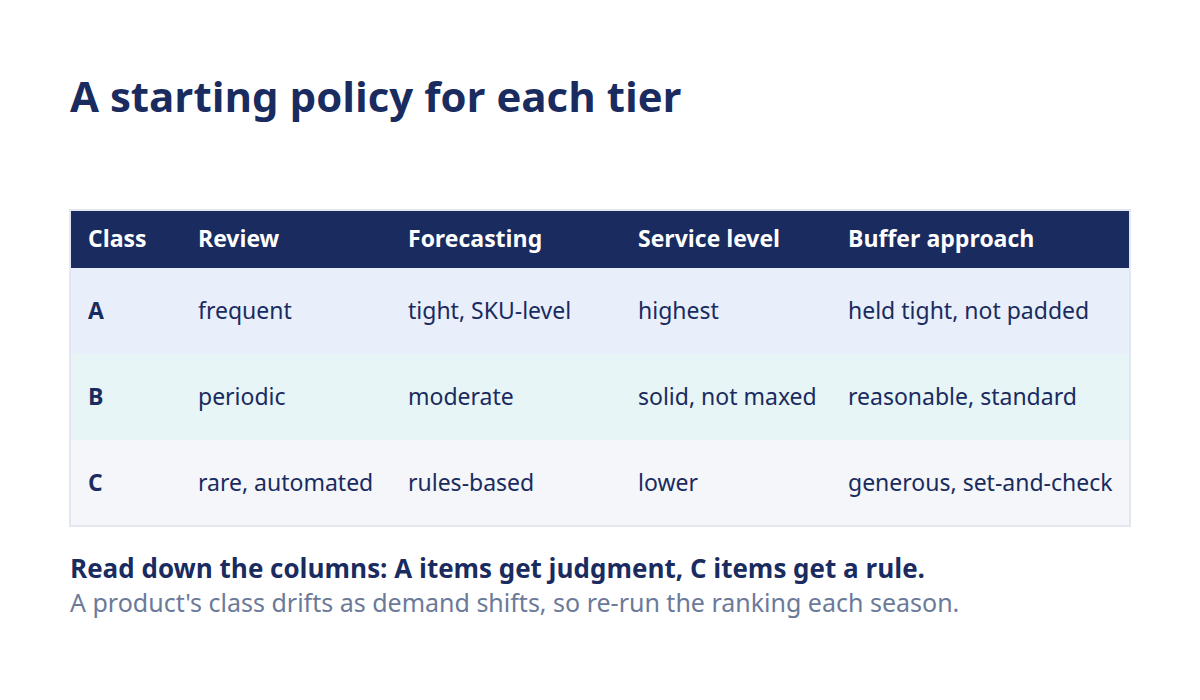
Here's a sensible starting policy for each tier:
- A: review cadence: Frequent, close watch; forecasting: Tight, SKU-level; service level: Highest; buffer approach: Held carefully, not padded
- B: review cadence: Periodic, slower cadence; forecasting: Moderate; service level: Solid but not maxed; buffer approach: Reasonable, standardized
- C: review cadence: Rare, mostly automated; forecasting: Simple / rules-based; service level: Lower; buffer approach: Generous, set-and-check
Read down the columns and the logic holds together. A items get your judgment. C items get a rule and a quarterly glance. B items sit in between, on a lighter periodic review rather than the constant attention your A items demand.
The mistake to avoid is treating this table as fixed forever. A product's class drifts as demand shifts. A last season's A item can slide to B, and a quiet C can suddenly break out. Rerun the analysis on a regular cadence, quarterly for most brands, so the policies keep matching reality.
Where ABC feeds the rest of your planning
ABC classes aren't a standalone report. They're an input that sharpens other decisions across your stack.
Your class drives how often you count stock: A items warrant more frequent cycle counting than the long tail, because errors on high-value SKUs hurt more. It also informs your service level and fill rate targets, since you'll defend availability harder on A items than on C. And once an item's class is set, it points you toward the right replenishment approach. That might be a formal reorder rule, or a simpler min/max and par level setup for the low-touch tail.
That's the payoff. ABC doesn't replace your forecasting or reorder math. It tells you where to spend it. And when you're running this across thousands of SKUs that keep shifting tiers, doing it by hand in a spreadsheet gets old fast. AI-powered inventory planning reclassifies your catalog automatically as demand moves and applies the right policy per tier. That keeps your attention on the A items that move the business, instead of on rebuilding the segmentation every quarter.
Frequently asked questions
What does ABC stand for in inventory?
ABC isn't an acronym for specific words. The letters simply label three value tiers, from most important to least. A items are your highest-value SKUs, B items are moderate, and C items are the low-value long tail. The naming borrows from grading, but the classes are effort tiers, not quality judgments about the products themselves.
Should I segment by revenue or by margin?
Revenue is the common default and a fine place to start. But a high-revenue, low-margin SKU can look more valuable than it really is. Ranking by margin contribution reflects actual profit, which often matters more for buying decisions. Many planners run both views, since revenue and margin can tell different stories about which products deserve the most attention.
What percentages define A, B, and C?
The classic split is 80/15/5 of cumulative value: A items make up the first 80%, B the next 15%, and C the final 5%. Those numbers are a convention, not a rule. Some brands use 70/20/10 or set cutoffs at the natural breaks in their cumulative value curve, then sanity-check that no tier is too crowded to be useful.
How often should I rerun ABC analysis?
Quarterly works for most brands, though seasonal or fast-moving catalogs may want it monthly. A product's class drifts as demand shifts, so a last season's A item can slide to B while a quiet C breaks out. Rerunning on a regular cadence keeps your per-class policies matched to current reality instead of a snapshot that's gone stale.
What's XYZ analysis versus ABC?
ABC ranks SKUs by value. XYZ ranks them by demand variability, or how predictable their sales are. X items sell steadily, Z items are erratic. Teams often combine the two into a nine-box grid, so a high-value, steady seller (AX) gets a very different plan from a high-value, unpredictable one (AZ). XYZ complements ABC rather than replacing it.
Can ABC analysis be automated?
Yes, and at any real catalog size it should be. Ranking, cumulative value, and cutoffs are straightforward to calculate, and doing it by hand every quarter across thousands of SKUs is slow and error-prone. AI-powered inventory planning reclassifies your catalog automatically as demand shifts and applies the matching policy per tier, though you'll still want to review the cutoffs periodically.