How AI Improves Demand Forecast Accuracy

AI improves demand forecast accuracy by weighing more signals than historical sales and updating more often than a spreadsheet. Here's the mechanism.
Your spreadsheet forecast uses one signal: last year's sales, nudged by a growth percentage someone picked in January. The market your product sells into uses a hundred. That gap between the evidence available and the evidence used is the gap AI closes, and it is a wider gap than most planners assume.
AI improves demand forecast accuracy two ways. It weighs many signals at once, seasonality, promotions, traffic, price, weather, instead of historical sales alone, and it updates far more often than a manual model. More signal and more frequent refresh mean fewer blind spots, which shows up as lower forecast error. How much lower depends on your data quality.
Key takeaways
- The lift comes from inputs and cadence, not magic: a wider signal set and a faster refresh, nothing more mysterious than that.
- Rules can only encode what someone thought of: a model learns relationships nobody wrote down, including non-linear ones.
- Refresh frequency is the underrated half: a forecast reviewed quarterly drifts for eleven weeks before anyone notices.
- Your data sets the ceiling: a model inherits the quality of what you feed it, and no method fixes a broken history.
Why are AI forecasts more accurate than rule-based ones?
Rule-based models lean on history; AI reads a wider set of signals, so it catches shifts a fixed rule can't. A rule is a decision someone made in advance and wrote down: take a twelve-week average, add 10% for the season, round up. It works exactly as well as the assumptions behind it, and it keeps working that way long after the assumptions stop being true. A learned model does not start from a rule. It starts from the data and works out which inputs actually predict this product's demand, then keeps re-deriving that relationship as new data arrives.
The practical consequence is not that the model is cleverer. It is that the model is allowed to consider evidence a rule never had room for.
More signals mean fewer blind spots. Count the inputs in a typical spreadsheet forecast and you usually find one: units sold in the same period last year. Maybe two, if someone maintains a promotional calendar. A learned model can weigh sales history alongside price changes, campaign activity, web traffic to the product page, channel mix, category trend, and calendar effects, all at once, and work out how much each one matters for this specific SKU. Every signal you add closes a blind spot that would otherwise show up as an unexplained miss. The classic example is a promotion: without campaign data in the model, a promotional week looks like an inexplicable demand spike, and next year's forecast either ignores it or bakes it in as normal. Both are wrong in expensive ways.
Non-linear patterns a rule can't model. The second advantage is subtler and matters more on the products that misbehave. Real demand is often non-linear: a 10% discount might lift units 15%, but a 30% discount lifts them 200% because it crosses a psychological price point. Two signals can interact, a promotion during peak season behaving nothing like the same promotion in a quiet month. A human-written rule has to flatten all of that into a single multiplier, because nobody can hand-code every interaction across a catalog. A learned model does not need them written down. It finds the shape in the data, including the shapes nobody thought to look for. That is where most of the accuracy difference on volatile SKUs comes from.
How does update frequency raise accuracy?
A forecast you refresh weekly drifts less than one you set quarterly and forget. This half of the story gets far less attention than the modelling half, and it is often the bigger lever. Every forecast starts decaying the moment it is published, because the conditions it assumed keep moving.
Why a quarterly forecast goes quietly wrong
Demand shifts, a supplier's lead time stretches, a competitor launches, and none of those events announce themselves to a spreadsheet written in July. A quarterly forecast spends eleven of its thirteen weeks progressively less true, and nobody finds out until the review meeting. By then the damage is already committed: the buys were placed against a number that stopped describing reality in week three. The problem is not that the original forecast was careless. It is that no forecast survives a quarter of contact with a live market, and a process that only checks once has no way to know when it stopped being right.
What changes when the model re-reads weekly
When a model re-reads the data every week, a demand shift shows up as a corrected number within days instead of being absorbed silently until the quarter closes. The correction is also smaller each time, which matters more than it sounds: a plan nudged by 5% four times is far easier to buy against than a plan revised by 25% once, because each small correction fits inside your existing supplier rhythm and the large one does not. The reason manual processes do not run weekly is simply cost. Rebuilding a forecast by hand across a few thousand SKUs is not a weekly job for a lean team, so the cadence gets set by available hours rather than by what the data deserves. Automating the re-fit removes that constraint, and the cadence becomes a choice again.

Where does AI accuracy stop, what are the limits?
AI inherits your data. Garbage history, garbage lift. This is the honest boundary on everything above, and it is worth stating plainly rather than burying in a caveat. A model learns the relationships present in the records you give it, so any distortion in those records becomes a distortion in the forecast. The most common one in eCommerce is stockout-censored demand: when a product sells out, your sales history records low demand for that week, but real demand was higher and you simply could not fill it. Feed that back into a model unmarked and it learns to under-forecast exactly the products that sell out, which is the worst possible place to be conservative.
Other ceilings are structural rather than fixable. A genuinely new product has no history for any method to learn from. A one-off event, a viral moment, a competitor's warehouse fire, is not predictable by anything reading your data. And accuracy is not a guarantee anyone can honestly offer, because it depends on your catalog, your data quality, and how volatile your category is. What a good setup can promise is a fair comparison: measure the model's error against the method it replaced, on your own SKUs, over the same period. That is the only benchmark that means anything. How you run that measurement is its own subject, covered in forecast accuracy metrics.
This is the reason Conative AI's proprietary deep-learning models are trained on years of real eCommerce data and run at the product level, with a data lakehouse cleaning and unifying storefront, inventory, and marketing data before it reaches the models. Forecast accuracy is tracked per SKU so you can watch the number improve rather than take it on trust, and every forecast that falls outside its accuracy guardrails gets flagged, so no one is asked to trust a black box. Book a call to see it run against your own history on the inventory planning platform.
Frequently asked questions
How much can AI improve forecast accuracy?
There is no honest single figure, because the answer depends on what you are replacing and how clean your data is. A brand moving off a twelve-week average on volatile SKUs usually sees a bigger change than one already running a tuned statistical model. The fair test is measuring the new method against your current one on your own history.
Does AI forecasting work for small product catalogs?
Yes, though the benefit is smaller. With a few dozen steady SKUs, a careful planner with a spreadsheet is genuinely competitive. The gap opens as the catalog grows and the long tail becomes too large to review individually, because that is where manual attention runs out first and automated attention does not.
What signals does AI use that spreadsheets don't?
Chiefly the ones that are hard to join by hand: live campaign activity and ad spend, product-page traffic, price changes, channel mix, and category trend, alongside the sales history a spreadsheet already has. Nothing stops you adding these manually. What stops most teams is that maintaining the joins across a catalog is a full-time job.
Can AI forecasting be wrong?
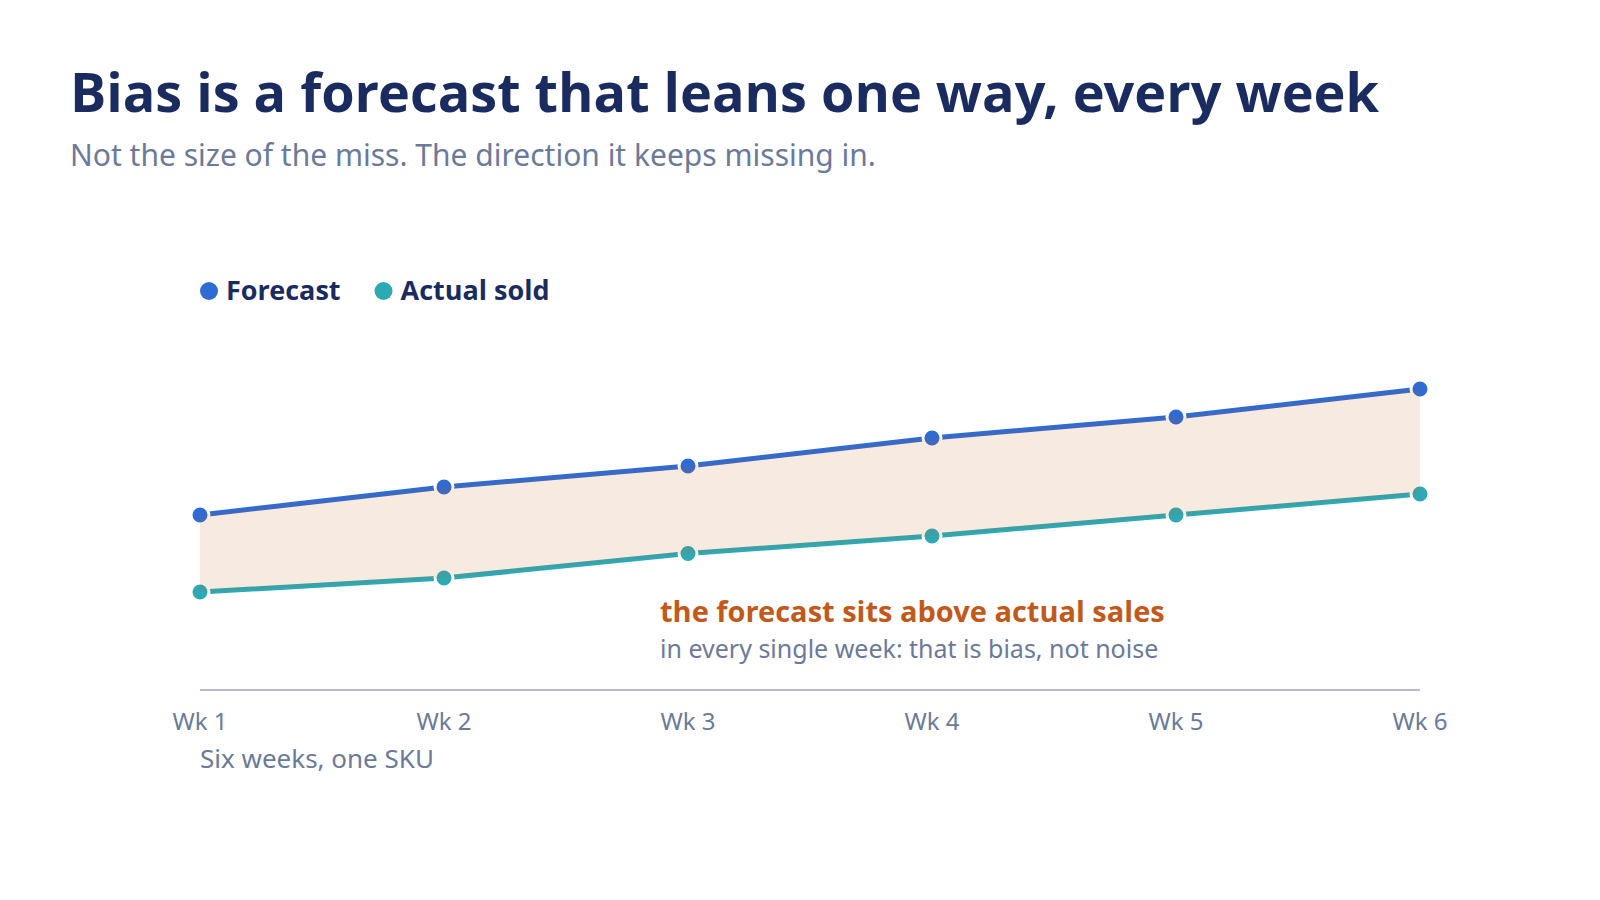
Frequently, and any vendor implying otherwise is overselling. Every forecast carries error; the goal is less error than the method it replaced, not zero. What matters is whether the misses are shrinking over time and whether they lean consistently in one direction, which is a separate problem from their size.
Is AI forecast accuracy guaranteed?
No. Accuracy depends on your data quality, catalog volatility, and forecast horizon, none of which a vendor controls. Treat any guaranteed accuracy claim as a warning sign. A credible setup shows you the measured error per SKU and lets you judge the trend yourself.
How is AI accuracy measured?
The same way any forecast accuracy is measured: compare forecast to actual sales over a period, at the level you buy, usually per SKU. Percentage-based and unit-based measures each answer different questions, and direction of error is tracked separately from size. Measuring the model against your previous method is what makes the number meaningful.